
Advertisement
- United States
- /
- Healthcare Services
- /
- NasdaqGS:AVAH
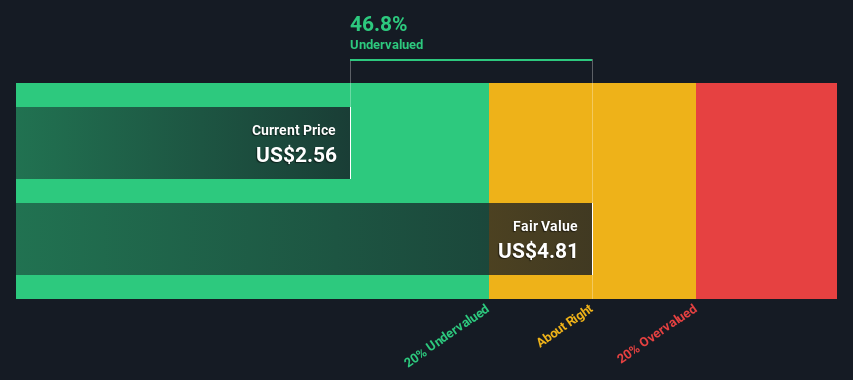
An Intrinsic Calculation For Aveanna Healthcare Holdings Inc. (NASDAQ:AVAH) Suggests It's 47% Undervalued
Key Insights
- The projected fair value for Aveanna Healthcare Holdings is US$4.81 based on 2 Stage Free Cash Flow to Equity
- Current share price of US$2.56 suggests Aveanna Healthcare Holdings is potentially 47% undervalued
- The US$2.35 analyst price target for AVAH is 51% less than our estimate of fair value
Today we'll do a simple run through of a valuation method used to estimate the attractiveness of Aveanna Healthcare Holdings Inc. (NASDAQ:AVAH) as an investment opportunity by projecting its future cash flows and then discounting them to today's value. This will be done using the Discounted Cash Flow (DCF) model. Before you think you won't be able to understand it, just read on! It's actually much less complex than you'd imagine.
Companies can be valued in a lot of ways, so we would point out that a DCF is not perfect for every situation. For those who are keen learners of equity analysis, the Simply Wall St analysis model here may be something of interest to you.
View our latest analysis for Aveanna Healthcare Holdings
The Model
We're using the 2-stage growth model, which simply means we take in account two stages of company's growth. In the initial period the company may have a higher growth rate and the second stage is usually assumed to have a stable growth rate. To start off with, we need to estimate the next ten years of cash flows. Where possible we use analyst estimates, but when these aren't available we extrapolate the previous free cash flow (FCF) from the last estimate or reported value. We assume companies with shrinking free cash flow will slow their rate of shrinkage, and that companies with growing free cash flow will see their growth rate slow, over this period. We do this to reflect that growth tends to slow more in the early years than it does in later years.
Generally we assume that a dollar today is more valuable than a dollar in the future, so we need to discount the sum of these future cash flows to arrive at a present value estimate:
10-year free cash flow (FCF) forecast
| 2024 | 2025 | 2026 | 2027 | 2028 | 2029 | 2030 | 2031 | 2032 | 2033 | |
| Levered FCF ($, Millions) | US$3.79m | US$3.01m | US$21.0m | US$34.8m | US$51.0m | US$68.0m | US$84.3m | US$99.1m | US$111.8m | US$122.7m |
| Growth Rate Estimate Source | Analyst x3 | Analyst x2 | Analyst x1 | Est @ 65.69% | Est @ 46.65% | Est @ 33.32% | Est @ 23.99% | Est @ 17.46% | Est @ 12.89% | Est @ 9.69% |
| Present Value ($, Millions) Discounted @ 10% | US$3.4 | US$2.5 | US$15.8 | US$23.7 | US$31.7 | US$38.4 | US$43.2 | US$46.2 | US$47.4 | US$47.2 |
("Est" = FCF growth rate estimated by Simply Wall St)
Present Value of 10-year Cash Flow (PVCF) = US$299m
We now need to calculate the Terminal Value, which accounts for all the future cash flows after this ten year period. The Gordon Growth formula is used to calculate Terminal Value at a future annual growth rate equal to the 5-year average of the 10-year government bond yield of 2.2%. We discount the terminal cash flows to today's value at a cost of equity of 10%.
Terminal Value (TV)= FCF2033 × (1 + g) ÷ (r – g) = US$123m× (1 + 2.2%) ÷ (10%– 2.2%) = US$1.6b
Present Value of Terminal Value (PVTV)= TV / (1 + r)10= US$1.6b÷ ( 1 + 10%)10= US$619m
The total value is the sum of cash flows for the next ten years plus the discounted terminal value, which results in the Total Equity Value, which in this case is US$918m. To get the intrinsic value per share, we divide this by the total number of shares outstanding. Relative to the current share price of US$2.6, the company appears quite good value at a 47% discount to where the stock price trades currently. Remember though, that this is just an approximate valuation, and like any complex formula - garbage in, garbage out.
Important Assumptions
The calculation above is very dependent on two assumptions. The first is the discount rate and the other is the cash flows. Part of investing is coming up with your own evaluation of a company's future performance, so try the calculation yourself and check your own assumptions. The DCF also does not consider the possible cyclicality of an industry, or a company's future capital requirements, so it does not give a full picture of a company's potential performance. Given that we are looking at Aveanna Healthcare Holdings as potential shareholders, the cost of equity is used as the discount rate, rather than the cost of capital (or weighted average cost of capital, WACC) which accounts for debt. In this calculation we've used 10%, which is based on a levered beta of 1.560. Beta is a measure of a stock's volatility, compared to the market as a whole. We get our beta from the industry average beta of globally comparable companies, with an imposed limit between 0.8 and 2.0, which is a reasonable range for a stable business.
SWOT Analysis for Aveanna Healthcare Holdings
Strength
- Debt is well covered by .
Weakness
- Interest payments on debt are not well covered.
- Shareholders have been diluted in the past year.
Opportunity
- Forecast to reduce losses next year.
- Good value based on P/S ratio and estimated fair value.
Threat
- Debt is not well covered by operating cash flow.
- Has less than 3 years of cash runway based on current free cash flow.
- Total liabilities exceed total assets, which raises the risk of financial distress.
- Not expected to become profitable over the next 3 years.
Next Steps:
Valuation is only one side of the coin in terms of building your investment thesis, and it ideally won't be the sole piece of analysis you scrutinize for a company. DCF models are not the be-all and end-all of investment valuation. Instead the best use for a DCF model is to test certain assumptions and theories to see if they would lead to the company being undervalued or overvalued. If a company grows at a different rate, or if its cost of equity or risk free rate changes sharply, the output can look very different. Can we work out why the company is trading at a discount to intrinsic value? For Aveanna Healthcare Holdings, we've put together three relevant aspects you should look at:
- Risks: Consider for instance, the ever-present spectre of investment risk. We've identified 4 warning signs with Aveanna Healthcare Holdings (at least 1 which is a bit unpleasant) , and understanding them should be part of your investment process.
- Future Earnings: How does AVAH's growth rate compare to its peers and the wider market? Dig deeper into the analyst consensus number for the upcoming years by interacting with our free analyst growth expectation chart.
- Other Solid Businesses: Low debt, high returns on equity and good past performance are fundamental to a strong business. Why not explore our interactive list of stocks with solid business fundamentals to see if there are other companies you may not have considered!
PS. The Simply Wall St app conducts a discounted cash flow valuation for every stock on the NASDAQGS every day. If you want to find the calculation for other stocks just search here.
New: Manage All Your Stock Portfolios in One Place
We've created the ultimate portfolio companion for stock investors, and it's free.
• Connect an unlimited number of Portfolios and see your total in one currency
• Be alerted to new Warning Signs or Risks via email or mobile
• Track the Fair Value of your stocks
Have feedback on this article? Concerned about the content? Get in touch with us directly. Alternatively, email editorial-team (at) simplywallst.com.
This article by Simply Wall St is general in nature. We provide commentary based on historical data and analyst forecasts only using an unbiased methodology and our articles are not intended to be financial advice. It does not constitute a recommendation to buy or sell any stock, and does not take account of your objectives, or your financial situation. We aim to bring you long-term focused analysis driven by fundamental data. Note that our analysis may not factor in the latest price-sensitive company announcements or qualitative material. Simply Wall St has no position in any stocks mentioned.
About NasdaqGS:AVAH
Aveanna Healthcare Holdings
A diversified home care platform company, provides pediatric and adult healthcare services in the United States.
Reasonable growth potential with slight risk.
Similar Companies
Market Insights

Advertisement
Community Narratives
Kodiak AI - a potential 100 bagger opportunity?
Fair Value US$14.00|44.7% undervalued
DA
Community Contributor
A Fair Price for a Great Business Facing Real Threats
Fair Value US$383.06|13.0% undervalued
IM
Community Contributor
AXON And Shopify Integration Will Unlock Global Mobile Advertising
Fair Value US$646.30|0% overvalued
AN
Based on Analyst Price Targets