Advertisement
- United States
- /
- Food
- /
- NYSE:GIS
Does General Mills Look Attractive in 2025 After Major Share Price Drop?

Simply Wall St
Reviewed by Bailey Pemberton
Trying to decide what move to make with General Mills stock? You are not alone. Sitting at $49.75 after another week of modest losses, investors are sizing up their next step. Over the past year, General Mills has seen its share price drop by 28.1%, and the decline has been even steeper when you look at the numbers since the start of the year, down 21.7%. A lot of this has to do with shifting interest rates and investors moving away from defensive consumer stocks like packaged foods in search of higher growth elsewhere. Long-term holders haven’t fared much better, with a five-year return that is still negative, at -5.9%.
However, recent price action does not always tell the whole story. Sometimes, it hints at a company being overlooked or mispriced. When we put General Mills through six different valuation checks, the company turns out undervalued in five of them, giving it an impressive valuation score of 5 out of 6. That is a strong showing considering the backdrop. If you are sizing up whether the current price represents an opportunity, understanding these valuation approaches will be key. Let’s break down each method one by one, and at the very end, we will reveal why one perspective might change how you view the whole picture.
Why General Mills is lagging behind its peers
Approach 1: General Mills Discounted Cash Flow (DCF) Analysis
The Discounted Cash Flow (DCF) model estimates a company's true value by projecting its future cash flows and then discounting those figures back to today’s dollars. This approach seeks to answer what General Mills is worth if we add up all the future cash it is expected to generate, adjusted for the time value of money.
For General Mills, the most recent reported Free Cash Flow stands at approximately $2.01 billion. Analysts have offered forecasts for the next several years, projecting steady growth, with Free Cash Flow expected to reach $2.22 billion by 2028. After year five, projections rely on longer-term estimates, and Simply Wall St extrapolates these out to cover a full decade. By 2035, the company’s Free Cash Flow is anticipated to approach $2.89 billion according to these models.
Based on all these projected and discounted cash flows, the DCF model calculates an intrinsic value for General Mills shares at $109.92. Compared to the current price of $49.75, the DCF valuation suggests the stock is 54.7 percent undervalued.
Result: UNDERVALUED
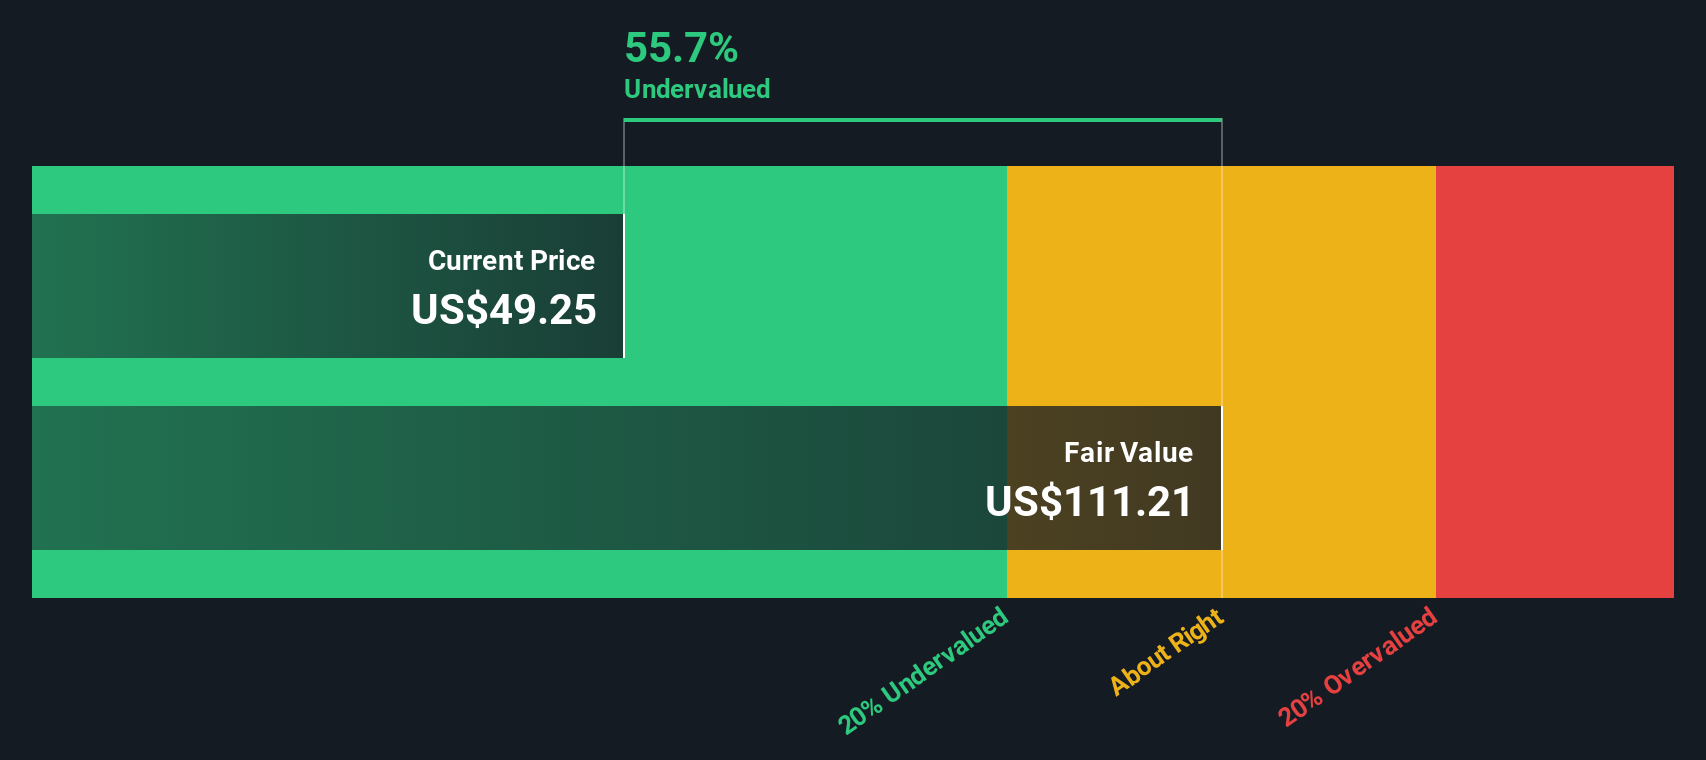
Our Discounted Cash Flow (DCF) analysis suggests General Mills is undervalued by 54.7%. Track this in your watchlist or portfolio, or discover more undervalued stocks.
Approach 2: General Mills Price vs Earnings (PE Ratio)
The Price-to-Earnings (PE) ratio is often the go-to metric when valuing established, profitable companies like General Mills. It represents how much investors are willing to pay for each dollar of a company’s earnings. This multiple is especially useful when a company has solid, predictable profits, which is the case here.
A “normal” or fair PE ratio for any company depends on factors such as how fast the company is expected to grow, the level of risk in its business, and how stable its profits are. Higher growth or lower risk can justify a higher PE, while lower growth or more uncertainty generally means a lower PE is warranted.
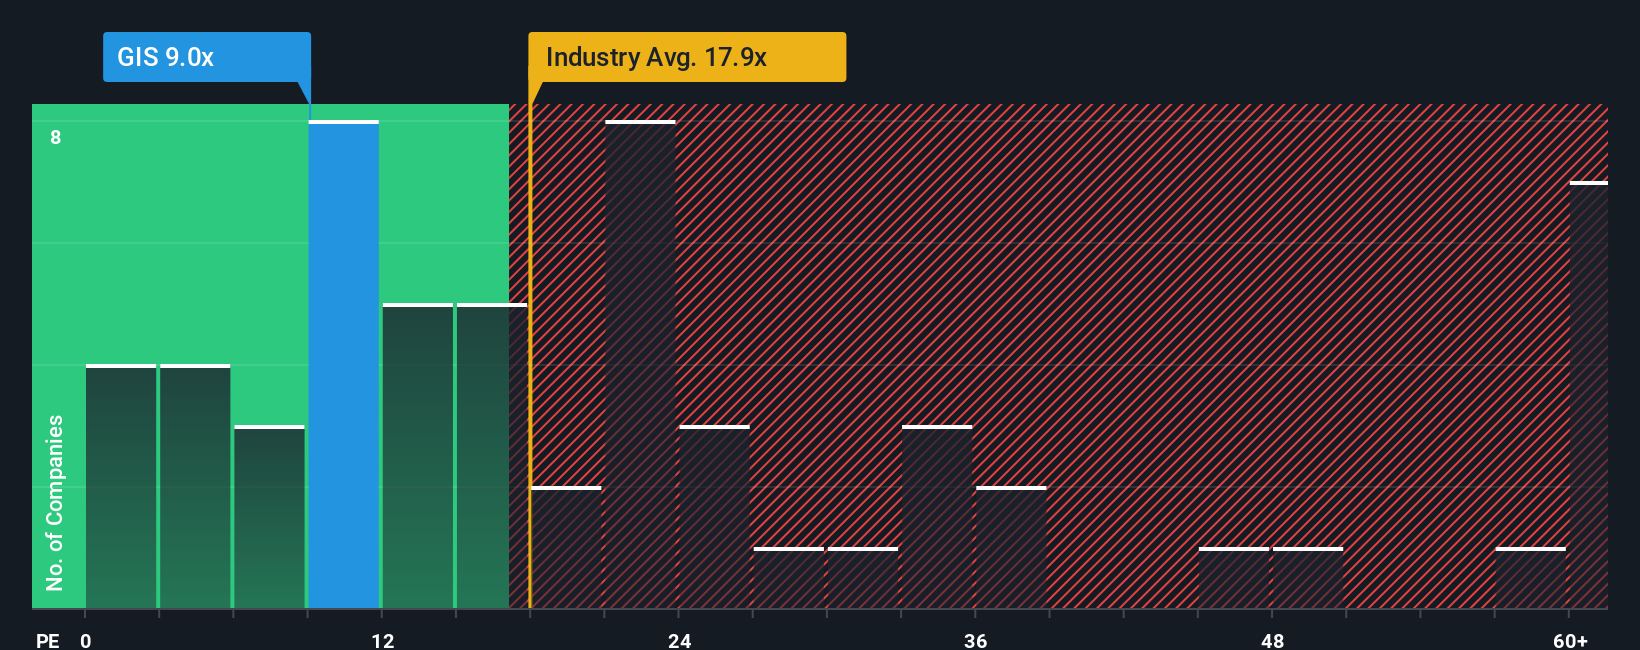
Currently, General Mills trades at a PE ratio of 9.1x. For context, this is well below both the food industry average of 17.7x and the average peer multiple of 23.5x. On the surface, this deep discount might look like a bargain, but it is important to dig deeper.
That is where Simply Wall St’s “Fair Ratio” comes in. The Fair Ratio is a proprietary calculation that determines what the company’s PE should be, taking into account not just earnings growth but also industry conditions, profit margins, market cap, and company-specific risks. This approach is more comprehensive than simply lining up the company against peers or the industry; it provides a tailored benchmark grounded in the company’s unique situation.
For General Mills, the Fair Ratio is set at 12.3x. Compared to the current 9.1x, the stock’s PE implies it is trading below its fair value by a significant margin, suggesting that the shares may be undervalued at present.
Result: UNDERVALUED
PE ratios tell one story, but what if the real opportunity lies elsewhere? Discover companies where insiders are betting big on explosive growth.
Upgrade Your Decision Making: Choose your General Mills Narrative
Earlier, we mentioned there is an even better way to understand a company's value, and that is through Narratives.
A Narrative is a simple, customizable story that lets you explain your personal perspective on a company behind the numbers, combining your assumptions about fair value, future revenue, earnings, and margins, and then see how those beliefs translate into a fair value estimate.
Narratives bridge the gap between a company's strategic story and financial forecast, making your big-picture expectations explicit and tying them directly to fair value. This works much like a roadmap connecting a company’s actual journey to its potential destination.
Anyone can try out Narratives quickly and for free on Simply Wall St’s Community page, where millions of investors are already using them, allowing you to see at a glance how your fair value compares to the current market price.
Since Narratives update dynamically as new data, earnings, or news emerge, you can track your thesis in real time and respond with confidence, adjusting your decision to buy, sell, or hold when the facts change.
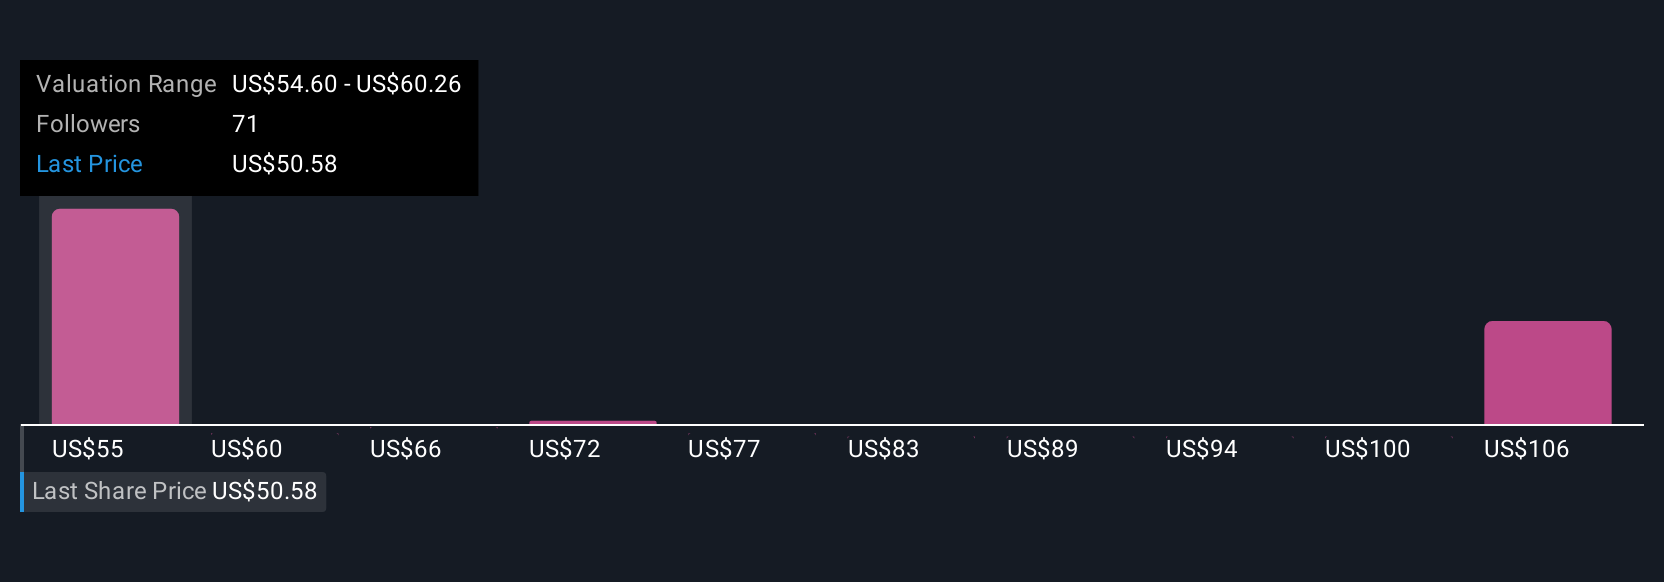
For example, among General Mills investors, the most optimistic Narrative forecasts a fair value as high as $63.00, while the most cautious pegs it down at $45.00. This underscores how even shared data can yield a wide range of views and strategies.
Do you think there's more to the story for General Mills? Create your own Narrative to let the Community know!
This article by Simply Wall St is general in nature. We provide commentary based on historical data and analyst forecasts only using an unbiased methodology and our articles are not intended to be financial advice. It does not constitute a recommendation to buy or sell any stock, and does not take account of your objectives, or your financial situation. We aim to bring you long-term focused analysis driven by fundamental data. Note that our analysis may not factor in the latest price-sensitive company announcements or qualitative material. Simply Wall St has no position in any stocks mentioned.
New: Manage All Your Stock Portfolios in One Place
We've created the ultimate portfolio companion for stock investors, and it's free.
• Connect an unlimited number of Portfolios and see your total in one currency
• Be alerted to new Warning Signs or Risks via email or mobile
• Track the Fair Value of your stocks
Have feedback on this article? Concerned about the content? Get in touch with us directly. Alternatively, email editorial-team@simplywallst.com
About NYSE:GIS
6 star dividend payer and undervalued.
Similar Companies
Market Insights

Advertisement
Community Narratives
A formidable player in AI and enterprise computing.
Fair Value US$210.00|12.2% overvalued
CO
Community Contributor
IREN's Bold Moves in Sustainable Bitcoin Mining & AI Data Centers
Fair Value US$72.52|17.1% undervalued
BL
Community Contributor
Cooling the Champions: The Aussie Tech Behind F1's Victories
Fair Value AU$12.40|38.7% undervalued
TR
Community Contributor