- United States
- /
- Oil and Gas
- /
- NYSE:WMB
Is It Too Late To Consider Williams After Its Strong Multi Year Share Price Rally?

Reviewed by Bailey Pemberton
- Wondering if Williams Companies at $61.55 is still worth buying after such a strong run, or if most of the upside is already priced in? Here is a closer look at what the market might be implying about its future cash flows and growth runway.
- The stock is up 2.2% over the last week, 3.3% over the past month, 10.1% year to date, and 16.8% over the last year, building on a 106.3% 3 year and 249.7% 5 year performance that appears to have shifted how investors see its risk reward profile.
- Recent headlines around US natural gas infrastructure, pipeline capacity constraints, and the ongoing role of midstream assets in the energy transition have kept Williams in the spotlight, as investors reassess how critical its network is to both reliability and decarbonization. At the same time, policy debates on permitting reform and long term gas demand expectations are influencing how the market values stable, toll like cash flows versus regulatory and environmental risks.
- In that context, Williams currently scores only 1 out of 6 on our valuation checks, suggesting it screens as undervalued on just one metric. This raises some important questions about how different models are treating its fundamentals. Next, we will walk through those valuation approaches one by one and, toward the end of the article, explore a more holistic way to judge whether the current price really makes sense.
Williams Companies scores just 1/6 on our valuation checks. See what other red flags we found in the full valuation breakdown.
Approach 1: Williams Companies Discounted Cash Flow (DCF) Analysis
A Discounted Cash Flow model estimates what a business is worth by projecting its future cash flows and then discounting them back to today in $, to account for time and risk. For Williams Companies, the model used is a 2 Stage Free Cash Flow to Equity approach.
The company generated about $2.3 billion in free cash flow over the last twelve months, and analysts expect this to climb meaningfully over time. Projections used in the model rise from around $2.2 billion in 2026 to roughly $4.3 billion by 2035, with the near term years informed by analyst estimates and the later years extrapolated by Simply Wall St based on more moderate growth assumptions.
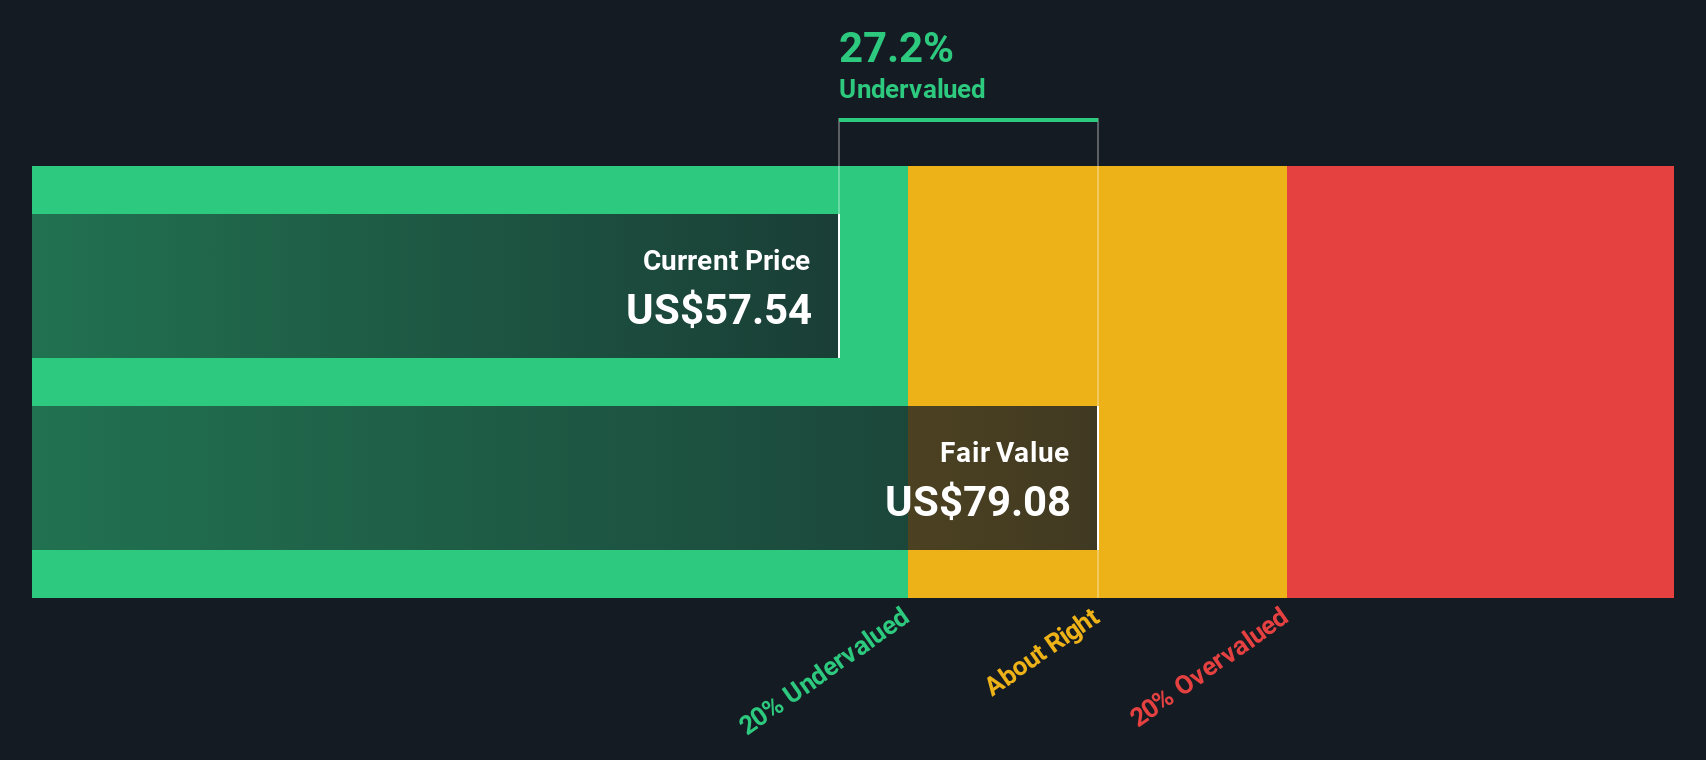
When these cash flows are discounted back to today, the DCF model produces an intrinsic value of about $71.71 per share. Compared with the current share price of $61.55, that implies the stock is roughly 14.2% undervalued, suggesting the market is not fully pricing in Williams cash generation and growth runway.
Result: UNDERVALUED
Our Discounted Cash Flow (DCF) analysis suggests Williams Companies is undervalued by 14.2%. Track this in your watchlist or portfolio, or discover 904 more undervalued stocks based on cash flows.
Approach 2: Williams Companies Price vs Earnings
For profitable, established businesses like Williams Companies, the price to earnings (PE) ratio is a useful way to see how much investors are willing to pay for each dollar of current earnings. A higher PE can be justified when a company has stronger growth prospects or lower perceived risk, while slower growth or higher uncertainty typically warrant a lower, more cautious multiple.
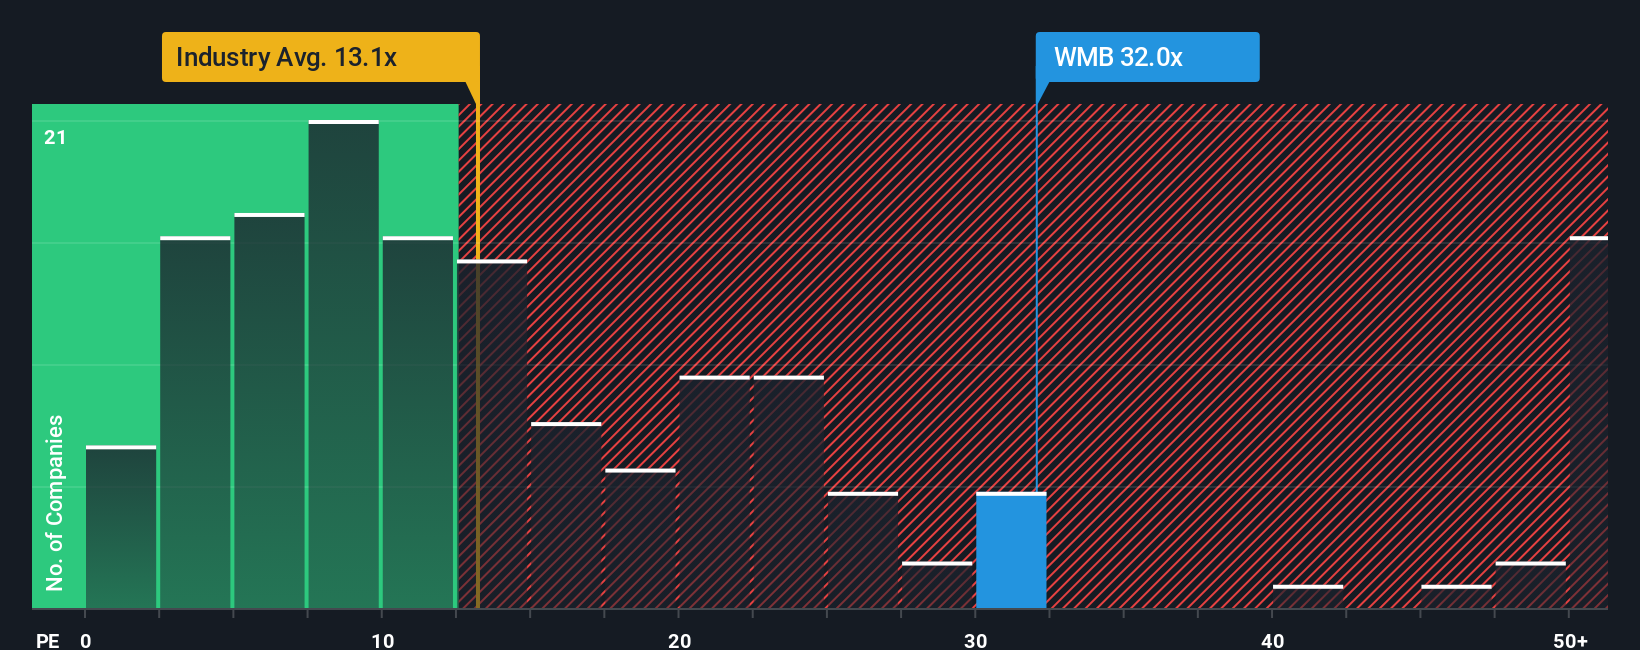
Williams currently trades at about 31.76x earnings, which is well above the broader Oil and Gas industry average of roughly 13.50x and also higher than the peer group average of around 14.89x. On the surface, that premium suggests investors are paying up for stability and growth, but it does not tell us whether the premium is actually warranted.
That is where Simply Wall St’s Fair Ratio comes in. This proprietary PE estimate, about 23.16x for Williams, reflects factors such as its earnings growth outlook, profit margins, industry dynamics, market cap and risk profile. Because it is tailored to the company rather than a broad group of peers, it offers a more precise benchmark than simple industry or peer comparisons. With the current PE of 31.76x sitting meaningfully above the 23.16x Fair Ratio, this multiple-based view points to the shares looking expensive on earnings.
Result: OVERVALUED
PE ratios tell one story, but what if the real opportunity lies elsewhere? Discover 1450 companies where insiders are betting big on explosive growth.
Upgrade Your Decision Making: Choose your Williams Companies Narrative
Earlier we mentioned that there is an even better way to understand valuation, so let us introduce you to Narratives, which are simple stories investors create to link their view of Williams Companies business to a set of forecast assumptions and then to a fair value estimate that can be compared with today’s share price. Instead of just accepting a single DCF or PE number, a Narrative lets you say what you think is likely for Williams future revenues, margins and earnings, and then see how that story translates into a valuation on Simply Wall St’s Community page, used by millions of investors. Because each Narrative is tied directly to a forecast model, it makes the buy or sell decision clearer by showing whether your Fair Value sits above or below the current Price, and it stays relevant because the inputs are dynamically updated when fresh news, earnings or guidance arrive. For example, one Williams Narrative might focus on LNG, data center power demand and margin expansion to justify a value closer to the most bullish 74 dollars target. A more cautious Narrative that emphasizes regulatory risk, decarbonization and stranded asset concerns could land nearer the 44 dollars bearish view.
Do you think there's more to the story for Williams Companies? Head over to our Community to see what others are saying!
This article by Simply Wall St is general in nature. We provide commentary based on historical data and analyst forecasts only using an unbiased methodology and our articles are not intended to be financial advice. It does not constitute a recommendation to buy or sell any stock, and does not take account of your objectives, or your financial situation. We aim to bring you long-term focused analysis driven by fundamental data. Note that our analysis may not factor in the latest price-sensitive company announcements or qualitative material. Simply Wall St has no position in any stocks mentioned.
Mobile Infrastructure for Defense and Disaster
The next wave in robotics isn't humanoid. Its fully autonomous towers delivering 5G, ISR, and radar in under 30 minutes, anywhere.
Get the investor briefing before the next round of contracts
Sponsored On Behalf of CiTechValuation is complex, but we're here to simplify it.
Discover if Williams Companies might be undervalued or overvalued with our detailed analysis, featuring fair value estimates, potential risks, dividends, insider trades, and its financial condition.
Access Free AnalysisHave feedback on this article? Concerned about the content? Get in touch with us directly. Alternatively, email editorial-team@simplywallst.com
About NYSE:WMB
Williams Companies
Operates as an energy infrastructure company primarily in the United States.
Limited growth with questionable track record.
Similar Companies
Market Insights

Weekly Picks

Early mover in a fast growing industry. Likely to experience share price volatility as they scale


A case for CA$31.80 (undiluted), aka 8,616% upside from CA$0.37 (an 86 bagger!).


Moderation and Stabilisation: HOLD: Fair Price based on a 4-year Cycle is $12.08
Recently Updated Narratives


An amazing opportunity to potentially get a 100 bagger

Amazon: Why the World’s Biggest Platform Still Runs on Invisible Economics

Sunrun Stock: When the Energy Transition Collides With the Cost of Capital
Popular Narratives


MicroVision will explode future revenue by 380.37% with a vision towards success


Crazy Undervalued 42 Baggers Silver Play (Active & Running Mine)


