- United States
- /
- Oil and Gas
- /
- NYSE:WMB
A Look At The Intrinsic Value Of The Williams Companies, Inc. (NYSE:WMB)


Key Insights
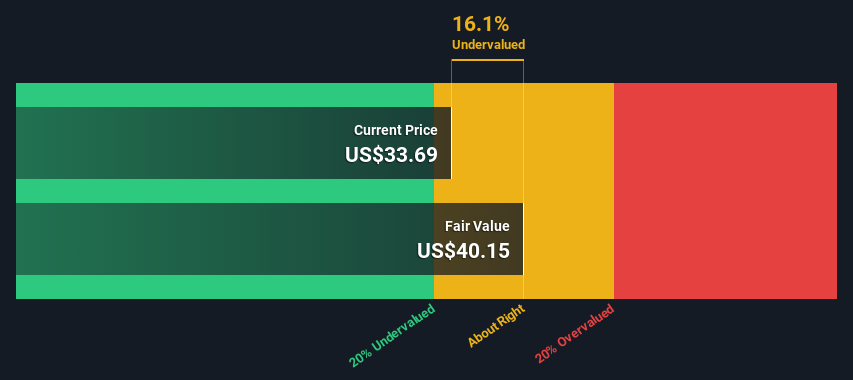
- Williams Companies' estimated fair value is US$40.15 based on 2 Stage Free Cash Flow to Equity
- Williams Companies' US$33.69 share price indicates it is trading at similar levels as its fair value estimate
- Analyst price target for WMB is US$37.31 which is 7.1% below our fair value estimate
Does the September share price for The Williams Companies, Inc. (NYSE:WMB) reflect what it's really worth? Today, we will estimate the stock's intrinsic value by taking the expected future cash flows and discounting them to their present value. This will be done using the Discounted Cash Flow (DCF) model. Before you think you won't be able to understand it, just read on! It's actually much less complex than you'd imagine.
Remember though, that there are many ways to estimate a company's value, and a DCF is just one method. Anyone interested in learning a bit more about intrinsic value should have a read of the Simply Wall St analysis model.
Check out our latest analysis for Williams Companies
Crunching The Numbers
We're using the 2-stage growth model, which simply means we take in account two stages of company's growth. In the initial period the company may have a higher growth rate and the second stage is usually assumed to have a stable growth rate. To begin with, we have to get estimates of the next ten years of cash flows. Where possible we use analyst estimates, but when these aren't available we extrapolate the previous free cash flow (FCF) from the last estimate or reported value. We assume companies with shrinking free cash flow will slow their rate of shrinkage, and that companies with growing free cash flow will see their growth rate slow, over this period. We do this to reflect that growth tends to slow more in the early years than it does in later years.
Generally we assume that a dollar today is more valuable than a dollar in the future, so we discount the value of these future cash flows to their estimated value in today's dollars:
10-year free cash flow (FCF) estimate
| 2024 | 2025 | 2026 | 2027 | 2028 | 2029 | 2030 | 2031 | 2032 | 2033 | |
| Levered FCF ($, Millions) | US$2.60b | US$3.21b | US$3.56b | US$3.84b | US$4.05b | US$4.24b | US$4.40b | US$4.54b | US$4.68b | US$4.81b |
| Growth Rate Estimate Source | Analyst x5 | Analyst x4 | Analyst x3 | Analyst x3 | Est @ 5.55% | Est @ 4.53% | Est @ 3.82% | Est @ 3.32% | Est @ 2.97% | Est @ 2.72% |
| Present Value ($, Millions) Discounted @ 9.8% | US$2.4k | US$2.7k | US$2.7k | US$2.6k | US$2.5k | US$2.4k | US$2.3k | US$2.2k | US$2.0k | US$1.9k |
("Est" = FCF growth rate estimated by Simply Wall St)
Present Value of 10-year Cash Flow (PVCF) = US$24b
After calculating the present value of future cash flows in the initial 10-year period, we need to calculate the Terminal Value, which accounts for all future cash flows beyond the first stage. For a number of reasons a very conservative growth rate is used that cannot exceed that of a country's GDP growth. In this case we have used the 5-year average of the 10-year government bond yield (2.2%) to estimate future growth. In the same way as with the 10-year 'growth' period, we discount future cash flows to today's value, using a cost of equity of 9.8%.
Terminal Value (TV)= FCF2033 × (1 + g) ÷ (r – g) = US$4.8b× (1 + 2.2%) ÷ (9.8%– 2.2%) = US$64b
Present Value of Terminal Value (PVTV)= TV / (1 + r)10= US$64b÷ ( 1 + 9.8%)10= US$25b
The total value, or equity value, is then the sum of the present value of the future cash flows, which in this case is US$49b. The last step is to then divide the equity value by the number of shares outstanding. Compared to the current share price of US$33.7, the company appears about fair value at a 16% discount to where the stock price trades currently. The assumptions in any calculation have a big impact on the valuation, so it is better to view this as a rough estimate, not precise down to the last cent.
Important Assumptions
We would point out that the most important inputs to a discounted cash flow are the discount rate and of course the actual cash flows. You don't have to agree with these inputs, I recommend redoing the calculations yourself and playing with them. The DCF also does not consider the possible cyclicality of an industry, or a company's future capital requirements, so it does not give a full picture of a company's potential performance. Given that we are looking at Williams Companies as potential shareholders, the cost of equity is used as the discount rate, rather than the cost of capital (or weighted average cost of capital, WACC) which accounts for debt. In this calculation we've used 9.8%, which is based on a levered beta of 1.531. Beta is a measure of a stock's volatility, compared to the market as a whole. We get our beta from the industry average beta of globally comparable companies, with an imposed limit between 0.8 and 2.0, which is a reasonable range for a stable business.
SWOT Analysis for Williams Companies
- Earnings growth over the past year exceeded the industry.
- Debt is well covered by earnings and cashflows.
- Dividends are covered by earnings and cash flows.
- Dividend is in the top 25% of dividend payers in the market.
- No major weaknesses identified for WMB.
- Current share price is below our estimate of fair value.
- Annual earnings are forecast to decline for the next 3 years.
Next Steps:
Whilst important, the DCF calculation is only one of many factors that you need to assess for a company. The DCF model is not a perfect stock valuation tool. Preferably you'd apply different cases and assumptions and see how they would impact the company's valuation. For instance, if the terminal value growth rate is adjusted slightly, it can dramatically alter the overall result. For Williams Companies, we've put together three pertinent factors you should consider:
- Risks: As an example, we've found 2 warning signs for Williams Companies (1 shouldn't be ignored!) that you need to consider before investing here.
- Future Earnings: How does WMB's growth rate compare to its peers and the wider market? Dig deeper into the analyst consensus number for the upcoming years by interacting with our free analyst growth expectation chart.
- Other Solid Businesses: Low debt, high returns on equity and good past performance are fundamental to a strong business. Why not explore our interactive list of stocks with solid business fundamentals to see if there are other companies you may not have considered!
PS. The Simply Wall St app conducts a discounted cash flow valuation for every stock on the NYSE every day. If you want to find the calculation for other stocks just search here.
Valuation is complex, but we're here to simplify it.
Discover if Williams Companies might be undervalued or overvalued with our detailed analysis, featuring fair value estimates, potential risks, dividends, insider trades, and its financial condition.
Access Free AnalysisHave feedback on this article? Concerned about the content? Get in touch with us directly. Alternatively, email editorial-team (at) simplywallst.com.
This article by Simply Wall St is general in nature. We provide commentary based on historical data and analyst forecasts only using an unbiased methodology and our articles are not intended to be financial advice. It does not constitute a recommendation to buy or sell any stock, and does not take account of your objectives, or your financial situation. We aim to bring you long-term focused analysis driven by fundamental data. Note that our analysis may not factor in the latest price-sensitive company announcements or qualitative material. Simply Wall St has no position in any stocks mentioned.
About NYSE:WMB
Williams Companies
Operates as an energy infrastructure company primarily in the United States.
Slight with moderate growth potential.

