Advertisement
- United States
- /
- Energy Services
- /
- NYSE:TDW
Does Tidewater’s Drop Signal Opportunity After 15% Slide in the Past Month?

Simply Wall St
Reviewed by Bailey Pemberton
If you have ever watched Tidewater’s stock chart, you know it is not a ticker for the faint of heart. Maybe you are sitting with a stack of shares and a big question: what now, with the price recently closing at $48.3? The last year has been a rollercoaster, with the stock sliding 22.3% in twelve months and 15.3% just this past month. Year-to-date, the stock is down 13.3%. Yet, zoom out to three or five years and you will see the type of headline growth most investors dream about. Over the past three years, Tidewater has climbed a strong 64.5%, and for those with the patience of a true long-term investor, the five-year return stands at an astonishing 677.8%.
Why all the swings? Much of Tidewater’s recent volatility can be traced to shifting market sentiment about the energy sector. Broader concerns about oil prices and global demand have certainly sent ripples through the industry, including Tidewater. At the same time, long-term optimism about energy infrastructure and offshore services continues to bubble beneath the surface. For now, investors seem to be recalibrating their views on risk, opportunity, and growth potential. This explains some of those sharp moves in both directions.
Here is the big kicker for anyone wondering how “cheap” or “expensive” Tidewater really is. According to our checks, Tidewater boasts a valuation score of 6 out of 6, meaning it is considered undervalued across every key metric we analyze. In the next sections, I will unpack exactly how these valuation approaches stack up, and there is an even more powerful way to figure out if the stock is a buy or not, which I will cover at the end of the article.
Why Tidewater is lagging behind its peers
Approach 1: Tidewater Discounted Cash Flow (DCF) Analysis
The Discounted Cash Flow (DCF) model estimates a stock’s intrinsic value by projecting a company’s future cash flows and discounting them back to today’s dollars. This approach provides a deep dive into what the business itself can generate for shareholders, regardless of the current market mood.
Tidewater’s latest Free Cash Flow (FCF) stands at $277.6 million. Analysts expect this cash flow to grow, projecting it will reach $552.96 million by 2035, according to a blend of short-term estimates and longer-term, extrapolated forecasts. Simply Wall St combines analyst predictions for the next several years and then extends these trends up to a 10-year window for a fuller picture.
All these cash flows, after being discounted to present value, contribute to an estimated fair value for the stock. For Tidewater, the DCF model places its intrinsic value at $174.99 per share. Compared to the current share price of $48.30, this represents a substantial 72.4% discount, suggesting the stock is significantly undervalued by market standards at this time.
Result: UNDERVALUED
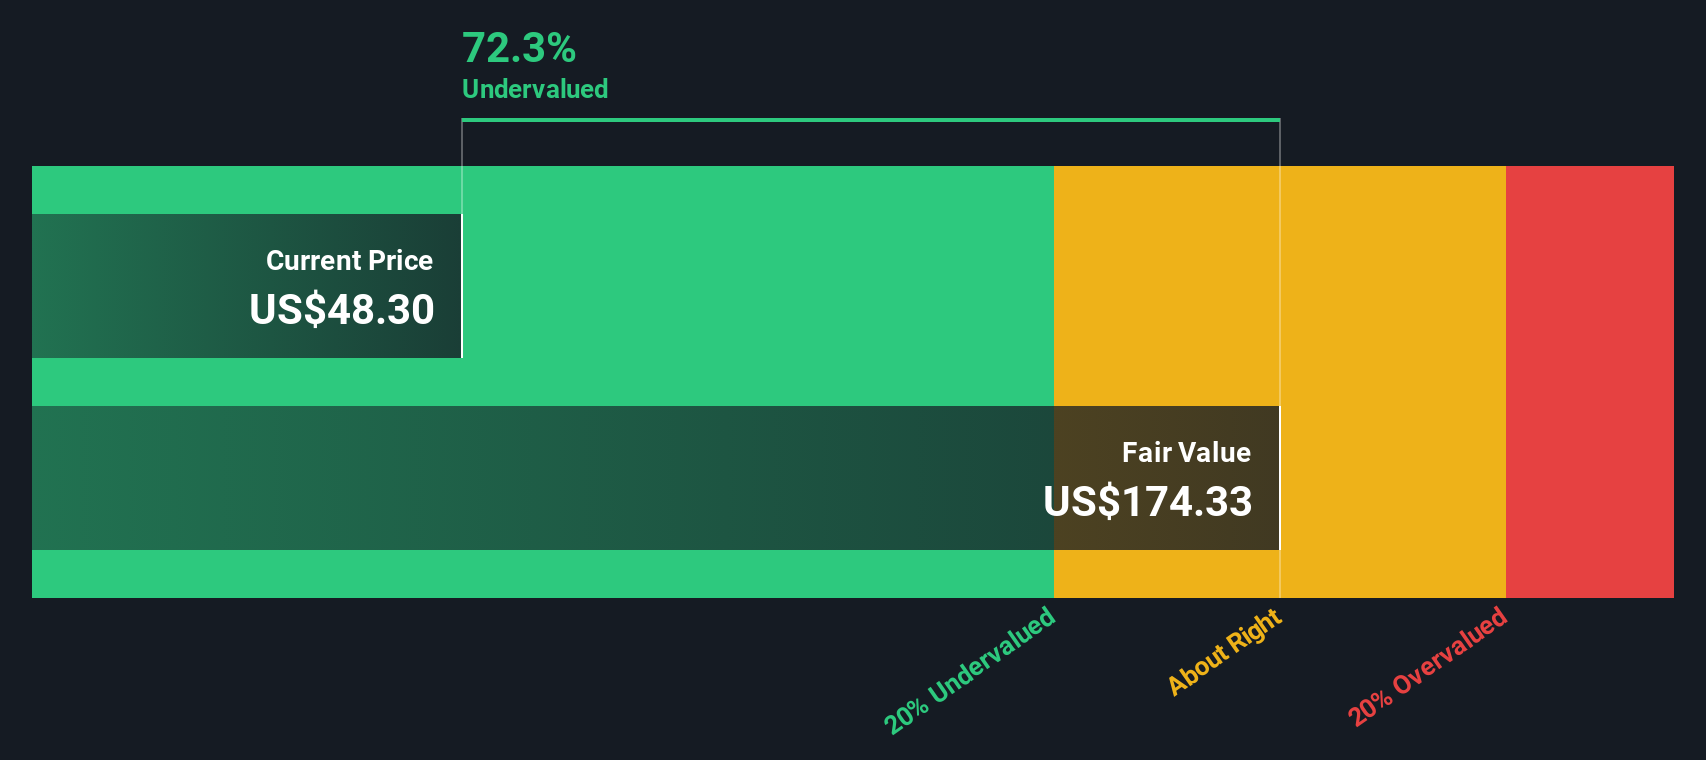
Our Discounted Cash Flow (DCF) analysis suggests Tidewater is undervalued by 72.4%. Track this in your watchlist or portfolio, or discover more undervalued stocks.
Approach 2: Tidewater Price vs Earnings
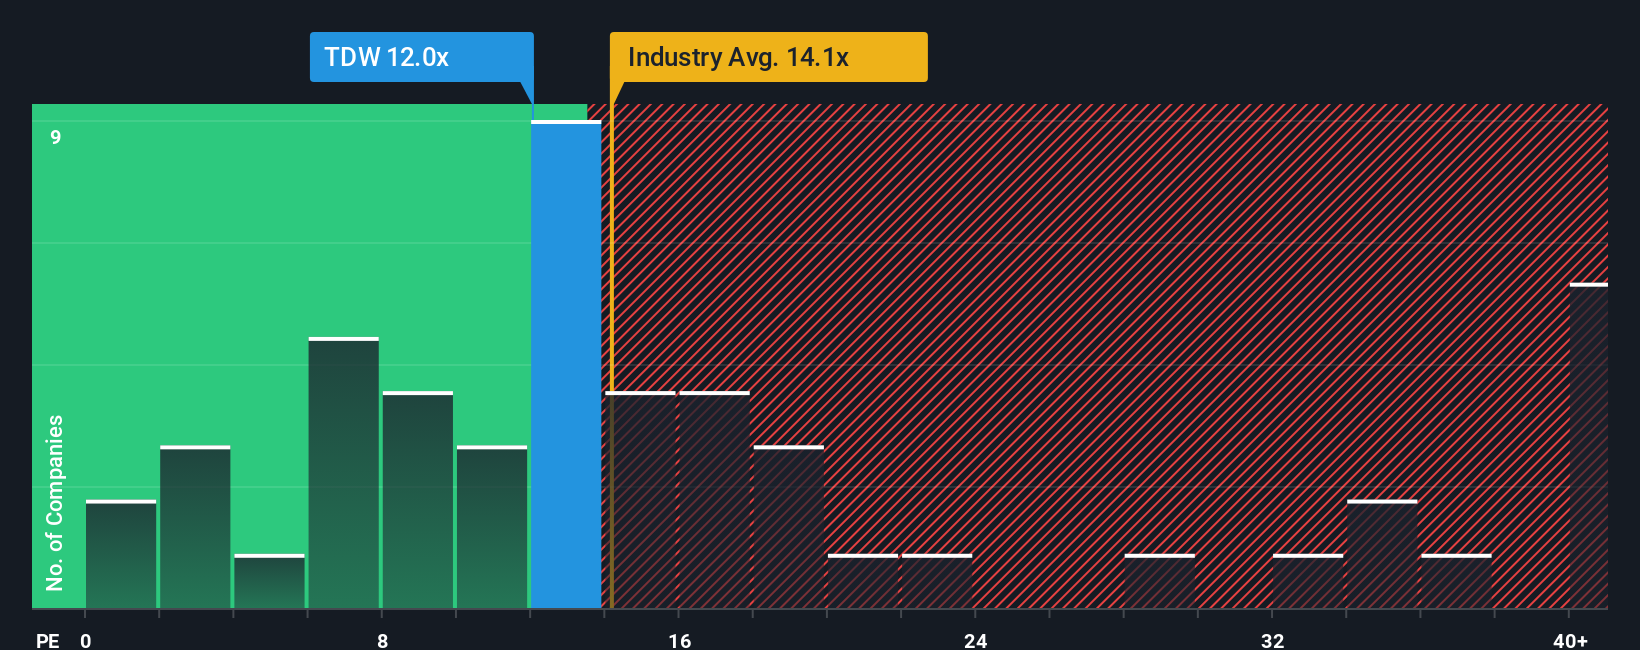
When it comes to profitable companies like Tidewater, the Price-to-Earnings (PE) ratio remains one of the most widely recognized valuation tools for investors. It helps you gauge how much the market is willing to pay today for a dollar of the company’s earnings, offering a straightforward lens to compare expectations for growth and risk among similar businesses.
A company with higher growth prospects or lower risks typically commands a higher PE ratio, while slower-growing or riskier companies trade at lower multiples. For Tidewater, the current PE ratio stands at 12x. To put this in context, the average PE ratio for its Energy Services industry peers is 14.1x, while the broader peer group trades at a much loftier 38x.
However, benchmarks like industry averages or direct peers do not always capture the full story. This is where Simply Wall St’s Fair Ratio comes in, a proprietary figure specifically tailored to Tidewater’s unique outlook. The Fair Ratio (15.3x) factors in not just the company’s current earnings, but also its growth rate, risks, profit margins, industry characteristics, and market cap. This approach offers a more nuanced, apples-to-apples comparison than simply lining up the PE ratios across the sector.
In this case, Tidewater’s actual PE ratio of 12x is notably below its Fair Ratio, suggesting the stock is undervalued based on its earnings profile and expected trajectory.
Result: UNDERVALUED
PE ratios tell one story, but what if the real opportunity lies elsewhere? Discover companies where insiders are betting big on explosive growth.
Upgrade Your Decision Making: Choose your Tidewater Narrative
Earlier we mentioned that there is an even better way to understand valuation, so let’s introduce you to Narratives. A Narrative is a simple and powerful tool that helps you connect a company’s story and future outlook with your own assumptions, linking what you believe about a business to a projected financial forecast and calculated fair value. Rather than just crunching numbers, Narratives give you the flexibility to choose or shape your perspective by adjusting assumptions about Tidewater’s future revenue, margins, and earnings right on Simply Wall St’s Community page, a feature trusted by millions of investors. This means you are not limited to only consensus estimates or a single fair value. Narratives empower you to see how your view compares to others and guide your decision of whether Tidewater’s current price is above or below what you believe is reasonable. Whenever news breaks or earnings are released, Narratives update in real time so your picture of the company is always current. For example, some investors see long-term profitability and set fair values as high as $70 per share, while others are more cautious and forecast as low as $35, showing how Narratives make these differences visible and actionable.
Do you think there's more to the story for Tidewater? Create your own Narrative to let the Community know!

This article by Simply Wall St is general in nature. We provide commentary based on historical data and analyst forecasts only using an unbiased methodology and our articles are not intended to be financial advice. It does not constitute a recommendation to buy or sell any stock, and does not take account of your objectives, or your financial situation. We aim to bring you long-term focused analysis driven by fundamental data. Note that our analysis may not factor in the latest price-sensitive company announcements or qualitative material. Simply Wall St has no position in any stocks mentioned.
Valuation is complex, but we're here to simplify it.
Discover if Tidewater might be undervalued or overvalued with our detailed analysis, featuring fair value estimates, potential risks, dividends, insider trades, and its financial condition.
Access Free AnalysisHave feedback on this article? Concerned about the content? Get in touch with us directly. Alternatively, email editorial-team@simplywallst.com
About NYSE:TDW
Tidewater
Provides offshore support vessels and marine support services to the offshore energy industry through the operation of a fleet of offshore marine service vessels worldwide.
Excellent balance sheet and fair value.
Similar Companies
Market Insights

Advertisement
Community Narratives
MicroVision will explode future revenue by 380.37% with a vision towards success
Fair Value US$60|98.4% undervalued
TH
Community Contributor
The Indispensable Artery for a New North American Economy
Fair Value CA$132.87|0.8% undervalued
TI
Community Contributor
Recently Updated Narratives
SW

swift11 on DXC Technology ·
CEO: We are winners in the long term in the AI world
Fair Value:US$8.1261.5% overvalued
1 followerusers have followed this narrative
0 commentsusers have commented on this narrative
0 likesusers have liked this narrative
AL

AlexLovell on Rocket Lab ·
Early mover in a fast growing industry. Likely to experience share price volatility as they scale
Fair Value:US$16.25158.0% overvalued
2 followersusers have followed this narrative
0 commentsusers have commented on this narrative
0 likesusers have liked this narrative
MA


MarkoVT on ANYCOLOR ·
Near zero debt, Japan centric focus provides future growth
Fair Value:JP¥7.61k15.3% undervalued
1 followerusers have followed this narrative
0 commentsusers have commented on this narrative
0 likesusers have liked this narrative
Popular Narratives
TH

TheWallstreetKing on MicroVision ·
MicroVision will explode future revenue by 380.37% with a vision towards success
Fair Value:US$6098.4% undervalued
97 followersusers have followed this narrative
10 commentsusers have commented on this narrative
19 likesusers have liked this narrative
OS


oscargarcia on Alphabet ·
The company that turned a verb into a global necessity and basically runs the modern internet, digital ads, smartphones, maps, and AI.
Fair Value:US$3405.9% undervalued
137 followersusers have followed this narrative
6 commentsusers have commented on this narrative
18 likesusers have liked this narrative
AN


AnalystConsensusTarget on NVIDIA ·
NVDA: Expanding AI Demand Will Drive Major Data Center Investments Through 2026
Fair Value:US$232.7922.6% undervalued
929 followersusers have followed this narrative
6 commentsusers have commented on this narrative
22 likesusers have liked this narrative