
Advertisement
- United States
- /
- Energy Services
- /
- NYSE:OII
Returns At Oceaneering International (NYSE:OII) Are On The Way Up
If you're not sure where to start when looking for the next multi-bagger, there are a few key trends you should keep an eye out for. Firstly, we'll want to see a proven return on capital employed (ROCE) that is increasing, and secondly, an expanding base of capital employed. If you see this, it typically means it's a company with a great business model and plenty of profitable reinvestment opportunities. Speaking of which, we noticed some great changes in Oceaneering International's (NYSE:OII) returns on capital, so let's have a look.
Understanding Return On Capital Employed (ROCE)
For those who don't know, ROCE is a measure of a company's yearly pre-tax profit (its return), relative to the capital employed in the business. The formula for this calculation on Oceaneering International is:
Return on Capital Employed = Earnings Before Interest and Tax (EBIT) ÷ (Total Assets - Current Liabilities)
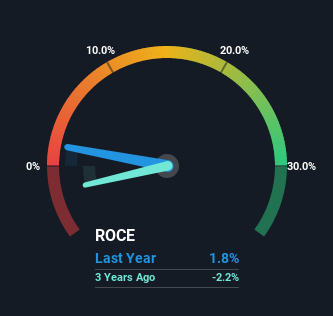
0.018 = US$25m ÷ (US$1.9b - US$473m) (Based on the trailing twelve months to June 2022).
Thus, Oceaneering International has an ROCE of 1.8%. In absolute terms, that's a low return and it also under-performs the Energy Services industry average of 5.8%.
Check out our latest analysis for Oceaneering International
In the above chart we have measured Oceaneering International's prior ROCE against its prior performance, but the future is arguably more important. If you'd like, you can check out the forecasts from the analysts covering Oceaneering International here for free.
The Trend Of ROCE
It's nice to see that ROCE is headed in the right direction, even if it is still relatively low. The figures show that over the last five years, returns on capital have grown by 1,651%. That's not bad because this tells for every dollar invested (capital employed), the company is increasing the amount earned from that dollar. Speaking of capital employed, the company is actually utilizing 46% less than it was five years ago, which can be indicative of a business that's improving its efficiency. If this trend continues, the business might be getting more efficient but it's shrinking in terms of total assets.
What We Can Learn From Oceaneering International's ROCE
In summary, it's great to see that Oceaneering International has been able to turn things around and earn higher returns on lower amounts of capital. And since the stock has fallen 62% over the last five years, there might be an opportunity here. That being the case, research into the company's current valuation metrics and future prospects seems fitting.
On a separate note, we've found 1 warning sign for Oceaneering International you'll probably want to know about.
If you want to search for solid companies with great earnings, check out this free list of companies with good balance sheets and impressive returns on equity.
New: AI Stock Screener & Alerts
Our new AI Stock Screener scans the market every day to uncover opportunities.
• Dividend Powerhouses (3%+ Yield)
• Undervalued Small Caps with Insider Buying
• High growth Tech and AI Companies
Or build your own from over 50 metrics.
Have feedback on this article? Concerned about the content? Get in touch with us directly. Alternatively, email editorial-team (at) simplywallst.com.
This article by Simply Wall St is general in nature. We provide commentary based on historical data and analyst forecasts only using an unbiased methodology and our articles are not intended to be financial advice. It does not constitute a recommendation to buy or sell any stock, and does not take account of your objectives, or your financial situation. We aim to bring you long-term focused analysis driven by fundamental data. Note that our analysis may not factor in the latest price-sensitive company announcements or qualitative material. Simply Wall St has no position in any stocks mentioned.
About NYSE:OII
Oceaneering International
Provides engineered services and products, and robotic solutions to the offshore energy, defense, aerospace, manufacturing, and entertainment industries in the United States, Africa, the United Kingdom, Norway, Brazil, Asia, Australia, and internationally.
Flawless balance sheet with solid track record.
Similar Companies
Market Insights

Advertisement
Community Narratives
MINISO's fair value is projected at 26.69 with an anticipated PE ratio shift of 20x
Fair Value US$24.03|11.0% undervalued
BE
Community Contributor
Procter & Gamble: A Dividend Giant Facing Slowing Growth
Fair Value US$119.81|23.3% overvalued
AN
Community Contributor
Eli Lilly's Future Growth Driven by Tirzepatide and Favorable Market Conditions
Fair Value US$1.19k|13.8% undervalued
EA
Community Contributor