
Advertisement
- United States
- /
- Oil and Gas
- /
- NYSE:LPG
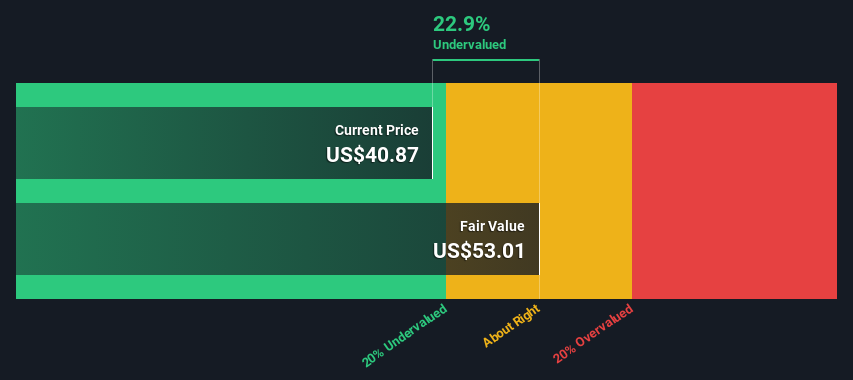
An Intrinsic Calculation For Dorian LPG Ltd. (NYSE:LPG) Suggests It's 23% Undervalued
Key Insights
- The projected fair value for DorianG is US$53.01 based on 2 Stage Free Cash Flow to Equity
- DorianG's US$40.87 share price signals that it might be 23% undervalued
- Analyst price target for LPG is US$40.54 which is 24% below our fair value estimate
Does the April share price for Dorian LPG Ltd. (NYSE:LPG) reflect what it's really worth? Today, we will estimate the stock's intrinsic value by taking the expected future cash flows and discounting them to today's value. One way to achieve this is by employing the Discounted Cash Flow (DCF) model. Models like these may appear beyond the comprehension of a lay person, but they're fairly easy to follow.
Remember though, that there are many ways to estimate a company's value, and a DCF is just one method. For those who are keen learners of equity analysis, the Simply Wall St analysis model here may be something of interest to you.
View our latest analysis for DorianG
Crunching The Numbers
We use what is known as a 2-stage model, which simply means we have two different periods of growth rates for the company's cash flows. Generally the first stage is higher growth, and the second stage is a lower growth phase. To begin with, we have to get estimates of the next ten years of cash flows. Where possible we use analyst estimates, but when these aren't available we extrapolate the previous free cash flow (FCF) from the last estimate or reported value. We assume companies with shrinking free cash flow will slow their rate of shrinkage, and that companies with growing free cash flow will see their growth rate slow, over this period. We do this to reflect that growth tends to slow more in the early years than it does in later years.
Generally we assume that a dollar today is more valuable than a dollar in the future, and so the sum of these future cash flows is then discounted to today's value:
10-year free cash flow (FCF) forecast
| 2024 | 2025 | 2026 | 2027 | 2028 | 2029 | 2030 | 2031 | 2032 | 2033 | |
| Levered FCF ($, Millions) | US$369.0m | US$279.0m | US$178.5m | US$156.6m | US$144.2m | US$137.3m | US$133.6m | US$131.9m | US$131.7m | US$132.5m |
| Growth Rate Estimate Source | Analyst x1 | Analyst x2 | Analyst x2 | Est @ -12.26% | Est @ -7.90% | Est @ -4.84% | Est @ -2.70% | Est @ -1.20% | Est @ -0.16% | Est @ 0.58% |
| Present Value ($, Millions) Discounted @ 8.8% | US$339 | US$236 | US$139 | US$112 | US$94.5 | US$82.6 | US$73.9 | US$67.1 | US$61.5 | US$56.9 |
("Est" = FCF growth rate estimated by Simply Wall St)
Present Value of 10-year Cash Flow (PVCF) = US$1.3b
After calculating the present value of future cash flows in the initial 10-year period, we need to calculate the Terminal Value, which accounts for all future cash flows beyond the first stage. The Gordon Growth formula is used to calculate Terminal Value at a future annual growth rate equal to the 5-year average of the 10-year government bond yield of 2.3%. We discount the terminal cash flows to today's value at a cost of equity of 8.8%.
Terminal Value (TV)= FCF2033 × (1 + g) ÷ (r – g) = US$133m× (1 + 2.3%) ÷ (8.8%– 2.3%) = US$2.1b
Present Value of Terminal Value (PVTV)= TV / (1 + r)10= US$2.1b÷ ( 1 + 8.8%)10= US$890m
The total value, or equity value, is then the sum of the present value of the future cash flows, which in this case is US$2.2b. In the final step we divide the equity value by the number of shares outstanding. Compared to the current share price of US$40.9, the company appears a touch undervalued at a 23% discount to where the stock price trades currently. The assumptions in any calculation have a big impact on the valuation, so it is better to view this as a rough estimate, not precise down to the last cent.
The Assumptions
Now the most important inputs to a discounted cash flow are the discount rate, and of course, the actual cash flows. If you don't agree with these result, have a go at the calculation yourself and play with the assumptions. The DCF also does not consider the possible cyclicality of an industry, or a company's future capital requirements, so it does not give a full picture of a company's potential performance. Given that we are looking at DorianG as potential shareholders, the cost of equity is used as the discount rate, rather than the cost of capital (or weighted average cost of capital, WACC) which accounts for debt. In this calculation we've used 8.8%, which is based on a levered beta of 1.421. Beta is a measure of a stock's volatility, compared to the market as a whole. We get our beta from the industry average beta of globally comparable companies, with an imposed limit between 0.8 and 2.0, which is a reasonable range for a stable business.
SWOT Analysis for DorianG
Strength
- Earnings growth over the past year exceeded the industry.
- Debt is well covered by earnings and cashflows.
- Dividends are covered by earnings and cash flows.
- Dividend is in the top 25% of dividend payers in the market.
Weakness
- No major weaknesses identified for LPG.
Opportunity
- Trading below our estimate of fair value by more than 20%.
- Significant insider buying over the past 3 months.
Threat
- Annual earnings are forecast to decline for the next 3 years.
Moving On:
Whilst important, the DCF calculation ideally won't be the sole piece of analysis you scrutinize for a company. The DCF model is not a perfect stock valuation tool. Preferably you'd apply different cases and assumptions and see how they would impact the company's valuation. If a company grows at a different rate, or if its cost of equity or risk free rate changes sharply, the output can look very different. Why is the intrinsic value higher than the current share price? For DorianG, there are three additional items you should consider:
- Risks: Be aware that DorianG is showing 3 warning signs in our investment analysis , and 1 of those is a bit concerning...
- Future Earnings: How does LPG's growth rate compare to its peers and the wider market? Dig deeper into the analyst consensus number for the upcoming years by interacting with our free analyst growth expectation chart.
- Other High Quality Alternatives: Do you like a good all-rounder? Explore our interactive list of high quality stocks to get an idea of what else is out there you may be missing!
PS. Simply Wall St updates its DCF calculation for every American stock every day, so if you want to find the intrinsic value of any other stock just search here.
New: Manage All Your Stock Portfolios in One Place
We've created the ultimate portfolio companion for stock investors, and it's free.
• Connect an unlimited number of Portfolios and see your total in one currency
• Be alerted to new Warning Signs or Risks via email or mobile
• Track the Fair Value of your stocks
Have feedback on this article? Concerned about the content? Get in touch with us directly. Alternatively, email editorial-team (at) simplywallst.com.
This article by Simply Wall St is general in nature. We provide commentary based on historical data and analyst forecasts only using an unbiased methodology and our articles are not intended to be financial advice. It does not constitute a recommendation to buy or sell any stock, and does not take account of your objectives, or your financial situation. We aim to bring you long-term focused analysis driven by fundamental data. Note that our analysis may not factor in the latest price-sensitive company announcements or qualitative material. Simply Wall St has no position in any stocks mentioned.
About NYSE:LPG
DorianG
Engages in the transportation of liquefied petroleum gas through its LPG tankers worldwide.
Undervalued with excellent balance sheet.
Similar Companies
Market Insights

Advertisement
Community Narratives
MicroVision will explode future revenue by 380.37% with a vision towards success
Fair Value US$60|98.4% undervalued
TH
Community Contributor
The Indispensable Artery for a New North American Economy
Fair Value CA$132.87|0.8% undervalued
TI
Community Contributor
Recently Updated Narratives
CO

composite32 on TAV Havalimanlari Holding ·
TAV Havalimanlari Holding will fly high with 25.68% revenue growth
Fair Value:₺545.1648.6% undervalued
3 followersusers have followed this narrative
0 commentsusers have commented on this narrative
0 likesusers have liked this narrative
RO


Robbo on Fiducian Group ·
Fiducian: Compliance Clouds or Value Opportunity?
Fair Value:AU$120.8% undervalued
1 followerusers have followed this narrative
0 commentsusers have commented on this narrative
0 likesusers have liked this narrative
MA


MarkoVT on COVER ·
Q3 Outlook modestly optimistic
Fair Value:JP¥1.65k1.3% overvalued
1 followerusers have followed this narrative
0 commentsusers have commented on this narrative
0 likesusers have liked this narrative
Popular Narratives
TH

TheWallstreetKing on MicroVision ·
MicroVision will explode future revenue by 380.37% with a vision towards success
Fair Value:US$6098.4% undervalued
93 followersusers have followed this narrative
10 commentsusers have commented on this narrative
18 likesusers have liked this narrative
OS


oscargarcia on Alphabet ·
The company that turned a verb into a global necessity and basically runs the modern internet, digital ads, smartphones, maps, and AI.
Fair Value:US$3405.9% undervalued
136 followersusers have followed this narrative
6 commentsusers have commented on this narrative
18 likesusers have liked this narrative
AN


AnalystConsensusTarget on NVIDIA ·
NVDA: Expanding AI Demand Will Drive Major Data Center Investments Through 2026
Fair Value:US$232.7922.6% undervalued
929 followersusers have followed this narrative
6 commentsusers have commented on this narrative
22 likesusers have liked this narrative