- United States
- /
- Oil and Gas
- /
- NYSE:DINO
Investing in HF Sinclair (NYSE:DINO) three years ago would have delivered you a 46% gain


While HF Sinclair Corporation (NYSE:DINO) shareholders are probably generally happy, the stock hasn't had particularly good run recently, with the share price falling 15% in the last quarter. But that shouldn't obscure the pleasing returns achieved by shareholders over the last three years. To wit, the share price did better than an index fund, climbing 34% during that period.
With that in mind, it's worth seeing if the company's underlying fundamentals have been the driver of long term performance, or if there are some discrepancies.
View our latest analysis for HF Sinclair
To paraphrase Benjamin Graham: Over the short term the market is a voting machine, but over the long term it's a weighing machine. One imperfect but simple way to consider how the market perception of a company has shifted is to compare the change in the earnings per share (EPS) with the share price movement.
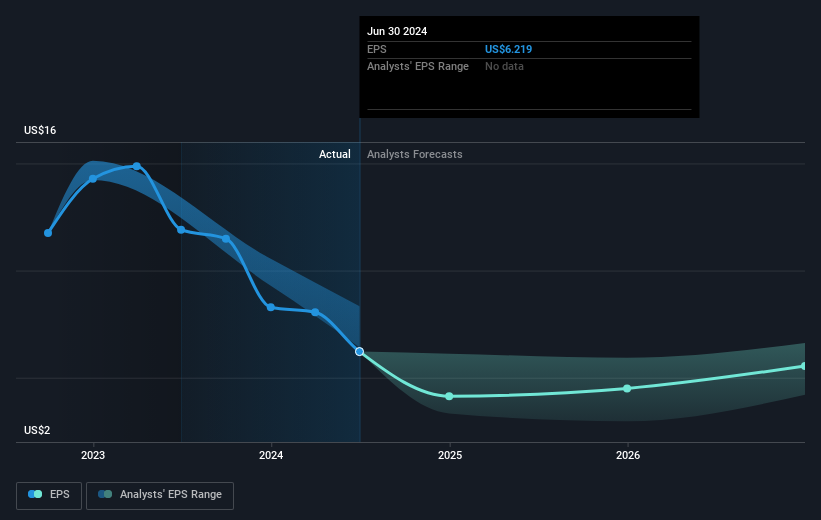
During three years of share price growth, HF Sinclair achieved compound earnings per share growth of 74% per year. The average annual share price increase of 10% is actually lower than the EPS growth. Therefore, it seems the market has moderated its expectations for growth, somewhat. We'd venture the lowish P/E ratio of 7.29 also reflects the negative sentiment around the stock.
You can see how EPS has changed over time in the image below (click on the chart to see the exact values).
We consider it positive that insiders have made significant purchases in the last year. Having said that, most people consider earnings and revenue growth trends to be a more meaningful guide to the business. This free interactive report on HF Sinclair's earnings, revenue and cash flow is a great place to start, if you want to investigate the stock further.
What About Dividends?
When looking at investment returns, it is important to consider the difference between total shareholder return (TSR) and share price return. Whereas the share price return only reflects the change in the share price, the TSR includes the value of dividends (assuming they were reinvested) and the benefit of any discounted capital raising or spin-off. So for companies that pay a generous dividend, the TSR is often a lot higher than the share price return. As it happens, HF Sinclair's TSR for the last 3 years was 46%, which exceeds the share price return mentioned earlier. The dividends paid by the company have thusly boosted the total shareholder return.
A Different Perspective
HF Sinclair shareholders are down 18% for the year (even including dividends), but the market itself is up 35%. However, keep in mind that even the best stocks will sometimes underperform the market over a twelve month period. Unfortunately, last year's performance may indicate unresolved challenges, given that it was worse than the annualised loss of 0.3% over the last half decade. We realise that Baron Rothschild has said investors should "buy when there is blood on the streets", but we caution that investors should first be sure they are buying a high quality business. It's always interesting to track share price performance over the longer term. But to understand HF Sinclair better, we need to consider many other factors. Case in point: We've spotted 4 warning signs for HF Sinclair you should be aware of, and 1 of them is a bit unpleasant.
HF Sinclair is not the only stock insiders are buying. So take a peek at this free list of small cap companies at attractive valuations which insiders have been buying.
Please note, the market returns quoted in this article reflect the market weighted average returns of stocks that currently trade on American exchanges.
Valuation is complex, but we're here to simplify it.
Discover if HF Sinclair might be undervalued or overvalued with our detailed analysis, featuring fair value estimates, potential risks, dividends, insider trades, and its financial condition.
Access Free AnalysisHave feedback on this article? Concerned about the content? Get in touch with us directly. Alternatively, email editorial-team (at) simplywallst.com.
This article by Simply Wall St is general in nature. We provide commentary based on historical data and analyst forecasts only using an unbiased methodology and our articles are not intended to be financial advice. It does not constitute a recommendation to buy or sell any stock, and does not take account of your objectives, or your financial situation. We aim to bring you long-term focused analysis driven by fundamental data. Note that our analysis may not factor in the latest price-sensitive company announcements or qualitative material. Simply Wall St has no position in any stocks mentioned.
About NYSE:DINO
Very undervalued with flawless balance sheet and pays a dividend.

