

Denbury Inc. (NYSE:DEN) just reported some strong earnings, and the market rewarded them with a positive share price move. We did some analysis and think that investors are missing some details hidden beneath the profit numbers.
Check out our latest analysis for Denbury
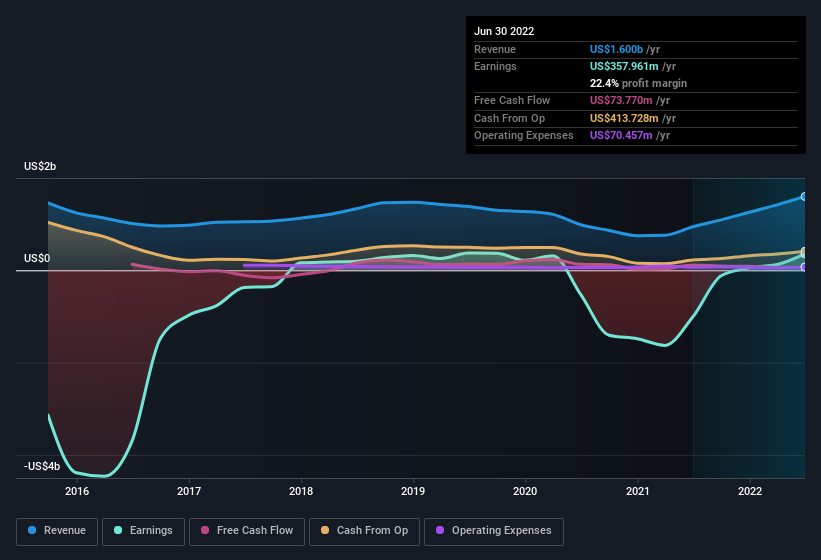
Examining Cashflow Against Denbury's Earnings
As finance nerds would already know, the accrual ratio from cashflow is a key measure for assessing how well a company's free cash flow (FCF) matches its profit. In plain english, this ratio subtracts FCF from net profit, and divides that number by the company's average operating assets over that period. You could think of the accrual ratio from cashflow as the 'non-FCF profit ratio'.
That means a negative accrual ratio is a good thing, because it shows that the company is bringing in more free cash flow than its profit would suggest. While having an accrual ratio above zero is of little concern, we do think it's worth noting when a company has a relatively high accrual ratio. That's because some academic studies have suggested that high accruals ratios tend to lead to lower profit or less profit growth.
For the year to June 2022, Denbury had an accrual ratio of 0.26. We can therefore deduce that its free cash flow fell well short of covering its statutory profit. Indeed, in the last twelve months it reported free cash flow of US$74m, which is significantly less than its profit of US$358.0m. Denbury shareholders will no doubt be hoping that its free cash flow bounces back next year, since it was down over the last twelve months. The good news for shareholders is that Denbury's accrual ratio was much better last year, so this year's poor reading might simply be a case of a short term mismatch between profit and FCF. As a result, some shareholders may be looking for stronger cash conversion in the current year.
That might leave you wondering what analysts are forecasting in terms of future profitability. Luckily, you can click here to see an interactive graph depicting future profitability, based on their estimates.
Our Take On Denbury's Profit Performance
Denbury didn't convert much of its profit to free cash flow in the last year, which some investors may consider rather suboptimal. Because of this, we think that it may be that Denbury's statutory profits are better than its underlying earnings power. The good news is that it earned a profit in the last twelve months, despite its previous loss. Of course, we've only just scratched the surface when it comes to analysing its earnings; one could also consider margins, forecast growth, and return on investment, among other factors. If you'd like to know more about Denbury as a business, it's important to be aware of any risks it's facing. For example, we've discovered 1 warning sign that you should run your eye over to get a better picture of Denbury.
This note has only looked at a single factor that sheds light on the nature of Denbury's profit. But there is always more to discover if you are capable of focussing your mind on minutiae. Some people consider a high return on equity to be a good sign of a quality business. So you may wish to see this free collection of companies boasting high return on equity, or this list of stocks that insiders are buying.
If you're looking to trade Denbury, open an account with the lowest-cost platform trusted by professionals, Interactive Brokers.
With clients in over 200 countries and territories, and access to 160 markets, IBKR lets you trade stocks, options, futures, forex, bonds and funds from a single integrated account.
Enjoy no hidden fees, no account minimums, and FX conversion rates as low as 0.03%, far better than what most brokers offer.
Sponsored ContentNew: Manage All Your Stock Portfolios in One Place
We've created the ultimate portfolio companion for stock investors, and it's free.
• Connect an unlimited number of Portfolios and see your total in one currency
• Be alerted to new Warning Signs or Risks via email or mobile
• Track the Fair Value of your stocks
Have feedback on this article? Concerned about the content? Get in touch with us directly. Alternatively, email editorial-team (at) simplywallst.com.
This article by Simply Wall St is general in nature. We provide commentary based on historical data and analyst forecasts only using an unbiased methodology and our articles are not intended to be financial advice. It does not constitute a recommendation to buy or sell any stock, and does not take account of your objectives, or your financial situation. We aim to bring you long-term focused analysis driven by fundamental data. Note that our analysis may not factor in the latest price-sensitive company announcements or qualitative material. Simply Wall St has no position in any stocks mentioned.
About NYSE:DEN
Denbury
Denbury Inc. operates as an independent energy company in the Gulf Coast and Rocky Mountain regions.
Solid track record with adequate balance sheet.
Similar Companies
Market Insights

Community Narratives

