
Advertisement
- United States
- /
- Oil and Gas
- /
- NYSE:CIVI
Civitas Resources, Inc.'s (NYSE:CIVI) Intrinsic Value Is Potentially 99% Above Its Share Price

Key Insights
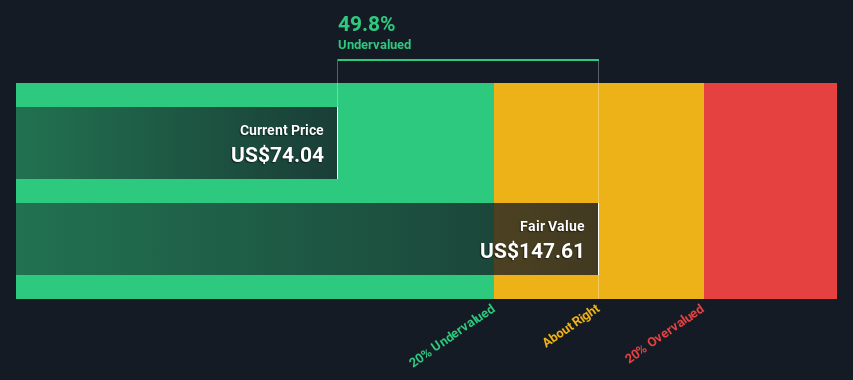
- Using the 2 Stage Free Cash Flow to Equity, Civitas Resources fair value estimate is US$148
- Current share price of US$74.04 suggests Civitas Resources is potentially 50% undervalued
- Our fair value estimate is 64% higher than Civitas Resources' analyst price target of US$90.18
How far off is Civitas Resources, Inc. (NYSE:CIVI) from its intrinsic value? Using the most recent financial data, we'll take a look at whether the stock is fairly priced by estimating the company's future cash flows and discounting them to their present value. One way to achieve this is by employing the Discounted Cash Flow (DCF) model. Before you think you won't be able to understand it, just read on! It's actually much less complex than you'd imagine.
Companies can be valued in a lot of ways, so we would point out that a DCF is not perfect for every situation. For those who are keen learners of equity analysis, the Simply Wall St analysis model here may be something of interest to you.
See our latest analysis for Civitas Resources
The Method
We are going to use a two-stage DCF model, which, as the name states, takes into account two stages of growth. The first stage is generally a higher growth period which levels off heading towards the terminal value, captured in the second 'steady growth' period. In the first stage we need to estimate the cash flows to the business over the next ten years. Where possible we use analyst estimates, but when these aren't available we extrapolate the previous free cash flow (FCF) from the last estimate or reported value. We assume companies with shrinking free cash flow will slow their rate of shrinkage, and that companies with growing free cash flow will see their growth rate slow, over this period. We do this to reflect that growth tends to slow more in the early years than it does in later years.
Generally we assume that a dollar today is more valuable than a dollar in the future, so we discount the value of these future cash flows to their estimated value in today's dollars:
10-year free cash flow (FCF) estimate
| 2024 | 2025 | 2026 | 2027 | 2028 | 2029 | 2030 | 2031 | 2032 | 2033 | |
| Levered FCF ($, Millions) | US$1.18b | US$1.19b | US$1.15b | US$1.14b | US$1.13b | US$1.14b | US$1.15b | US$1.17b | US$1.19b | US$1.21b |
| Growth Rate Estimate Source | Analyst x5 | Analyst x5 | Analyst x3 | Est @ -1.24% | Est @ -0.18% | Est @ 0.56% | Est @ 1.08% | Est @ 1.44% | Est @ 1.70% | Est @ 1.87% |
| Present Value ($, Millions) Discounted @ 9.2% | US$1.1k | US$995 | US$884 | US$800 | US$731 | US$674 | US$624 | US$580 | US$540 | US$504 |
("Est" = FCF growth rate estimated by Simply Wall St)
Present Value of 10-year Cash Flow (PVCF) = US$7.4b
We now need to calculate the Terminal Value, which accounts for all the future cash flows after this ten year period. The Gordon Growth formula is used to calculate Terminal Value at a future annual growth rate equal to the 5-year average of the 10-year government bond yield of 2.3%. We discount the terminal cash flows to today's value at a cost of equity of 9.2%.
Terminal Value (TV)= FCF2033 × (1 + g) ÷ (r – g) = US$1.2b× (1 + 2.3%) ÷ (9.2%– 2.3%) = US$18b
Present Value of Terminal Value (PVTV)= TV / (1 + r)10= US$18b÷ ( 1 + 9.2%)10= US$7.5b
The total value, or equity value, is then the sum of the present value of the future cash flows, which in this case is US$15b. The last step is to then divide the equity value by the number of shares outstanding. Compared to the current share price of US$74.0, the company appears quite undervalued at a 50% discount to where the stock price trades currently. The assumptions in any calculation have a big impact on the valuation, so it is better to view this as a rough estimate, not precise down to the last cent.
The Assumptions
Now the most important inputs to a discounted cash flow are the discount rate, and of course, the actual cash flows. You don't have to agree with these inputs, I recommend redoing the calculations yourself and playing with them. The DCF also does not consider the possible cyclicality of an industry, or a company's future capital requirements, so it does not give a full picture of a company's potential performance. Given that we are looking at Civitas Resources as potential shareholders, the cost of equity is used as the discount rate, rather than the cost of capital (or weighted average cost of capital, WACC) which accounts for debt. In this calculation we've used 9.2%, which is based on a levered beta of 1.495. Beta is a measure of a stock's volatility, compared to the market as a whole. We get our beta from the industry average beta of globally comparable companies, with an imposed limit between 0.8 and 2.0, which is a reasonable range for a stable business.
SWOT Analysis for Civitas Resources
Strength
- Debt is well covered by earnings and cashflows.
- Dividend is in the top 25% of dividend payers in the market.
Weakness
- Earnings declined over the past year.
- Shareholders have been diluted in the past year.
Opportunity
- Annual earnings are forecast to grow faster than the American market.
- Good value based on P/E ratio and estimated fair value.
Threat
- Dividends are not covered by cash flow.
- Revenue is forecast to grow slower than 20% per year.
Next Steps:
Although the valuation of a company is important, it shouldn't be the only metric you look at when researching a company. DCF models are not the be-all and end-all of investment valuation. Rather it should be seen as a guide to "what assumptions need to be true for this stock to be under/overvalued?" For instance, if the terminal value growth rate is adjusted slightly, it can dramatically alter the overall result. Why is the intrinsic value higher than the current share price? For Civitas Resources, we've put together three pertinent aspects you should further research:
- Risks: Every company has them, and we've spotted 4 warning signs for Civitas Resources you should know about.
- Future Earnings: How does CIVI's growth rate compare to its peers and the wider market? Dig deeper into the analyst consensus number for the upcoming years by interacting with our free analyst growth expectation chart.
- Other Solid Businesses: Low debt, high returns on equity and good past performance are fundamental to a strong business. Why not explore our interactive list of stocks with solid business fundamentals to see if there are other companies you may not have considered!
PS. The Simply Wall St app conducts a discounted cash flow valuation for every stock on the NYSE every day. If you want to find the calculation for other stocks just search here.
New: AI Stock Screener & Alerts
Our new AI Stock Screener scans the market every day to uncover opportunities.
• Dividend Powerhouses (3%+ Yield)
• Undervalued Small Caps with Insider Buying
• High growth Tech and AI Companies
Or build your own from over 50 metrics.
Have feedback on this article? Concerned about the content? Get in touch with us directly. Alternatively, email editorial-team (at) simplywallst.com.
This article by Simply Wall St is general in nature. We provide commentary based on historical data and analyst forecasts only using an unbiased methodology and our articles are not intended to be financial advice. It does not constitute a recommendation to buy or sell any stock, and does not take account of your objectives, or your financial situation. We aim to bring you long-term focused analysis driven by fundamental data. Note that our analysis may not factor in the latest price-sensitive company announcements or qualitative material. Simply Wall St has no position in any stocks mentioned.
About NYSE:CIVI
Civitas Resources
An exploration and production company, focuses on the acquisition, development, and production of crude oil and associated liquids-rich natural gas.
Undervalued average dividend payer.
Similar Companies
Market Insights


Advertisement
Community Narratives
A Quality Compounder Marked Down on Overblown Fears
Fair Value US$120.72|62.4% undervalued
BA
Community Contributor

Wyndham Continues Global Expansion with 19% Ancillary Revenue Growth
Fair Value US$105.80|19.2% undervalued
ZW
Community Contributor