
Advertisement
- United States
- /
- Energy Services
- /
- NasdaqCM:NESR
National Energy Services Reunited (NASDAQ:NESR) Has A Somewhat Strained Balance Sheet

Howard Marks put it nicely when he said that, rather than worrying about share price volatility, 'The possibility of permanent loss is the risk I worry about... and every practical investor I know worries about.' So it might be obvious that you need to consider debt, when you think about how risky any given stock is, because too much debt can sink a company. Importantly, National Energy Services Reunited Corp. (NASDAQ:NESR) does carry debt. But is this debt a concern to shareholders?
When Is Debt Dangerous?
Debt is a tool to help businesses grow, but if a business is incapable of paying off its lenders, then it exists at their mercy. Ultimately, if the company can't fulfill its legal obligations to repay debt, shareholders could walk away with nothing. However, a more common (but still painful) scenario is that it has to raise new equity capital at a low price, thus permanently diluting shareholders. Of course, the upside of debt is that it often represents cheap capital, especially when it replaces dilution in a company with the ability to reinvest at high rates of return. The first step when considering a company's debt levels is to consider its cash and debt together.
View our latest analysis for National Energy Services Reunited
What Is National Energy Services Reunited's Net Debt?
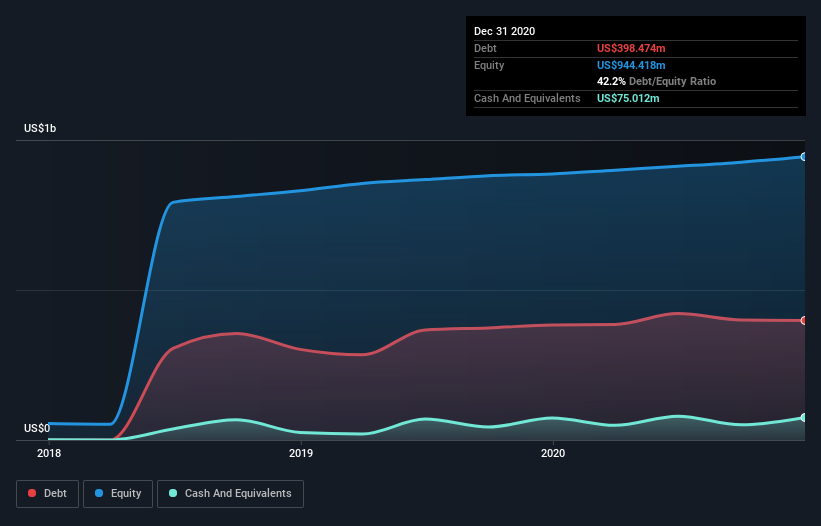
As you can see below, National Energy Services Reunited had US$398.5m of debt, at December 2020, which is about the same as the year before. You can click the chart for greater detail. On the flip side, it has US$75.0m in cash leading to net debt of about US$323.5m.
A Look At National Energy Services Reunited's Liabilities
We can see from the most recent balance sheet that National Energy Services Reunited had liabilities of US$359.4m falling due within a year, and liabilities of US$383.3m due beyond that. On the other hand, it had cash of US$75.0m and US$293.7m worth of receivables due within a year. So its liabilities total US$373.9m more than the combination of its cash and short-term receivables.
This deficit isn't so bad because National Energy Services Reunited is worth US$1.15b, and thus could probably raise enough capital to shore up its balance sheet, if the need arose. But we definitely want to keep our eyes open to indications that its debt is bringing too much risk.
We measure a company's debt load relative to its earnings power by looking at its net debt divided by its earnings before interest, tax, depreciation, and amortization (EBITDA) and by calculating how easily its earnings before interest and tax (EBIT) cover its interest expense (interest cover). The advantage of this approach is that we take into account both the absolute quantum of debt (with net debt to EBITDA) and the actual interest expenses associated with that debt (with its interest cover ratio).
National Energy Services Reunited's net debt is sitting at a very reasonable 1.7 times its EBITDA, while its EBIT covered its interest expense just 4.3 times last year. It seems that the business incurs large depreciation and amortisation charges, so maybe its debt load is heavier than it would first appear, since EBITDA is arguably a generous measure of earnings. Sadly, National Energy Services Reunited's EBIT actually dropped 4.4% in the last year. If earnings continue on that decline then managing that debt will be difficult like delivering hot soup on a unicycle. There's no doubt that we learn most about debt from the balance sheet. But it is future earnings, more than anything, that will determine National Energy Services Reunited's ability to maintain a healthy balance sheet going forward. So if you're focused on the future you can check out this free report showing analyst profit forecasts.
Finally, while the tax-man may adore accounting profits, lenders only accept cold hard cash. So the logical step is to look at the proportion of that EBIT that is matched by actual free cash flow. In the last three years, National Energy Services Reunited's free cash flow amounted to 23% of its EBIT, less than we'd expect. That weak cash conversion makes it more difficult to handle indebtedness.
Our View
While National Energy Services Reunited's EBIT growth rate makes us cautious about it, its track record of converting EBIT to free cash flow is no better. At least its net debt to EBITDA gives us reason to be optimistic. Taking the abovementioned factors together we do think National Energy Services Reunited's debt poses some risks to the business. While that debt can boost returns, we think the company has enough leverage now. When analysing debt levels, the balance sheet is the obvious place to start. But ultimately, every company can contain risks that exist outside of the balance sheet. We've identified 1 warning sign with National Energy Services Reunited , and understanding them should be part of your investment process.
If you're interested in investing in businesses that can grow profits without the burden of debt, then check out this free list of growing businesses that have net cash on the balance sheet.
If you decide to trade National Energy Services Reunited, use the lowest-cost* platform that is rated #1 Overall by Barron’s, Interactive Brokers. Trade stocks, options, futures, forex, bonds and funds on 135 markets, all from a single integrated account. Promoted
Valuation is complex, but we're here to simplify it.
Discover if National Energy Services Reunited might be undervalued or overvalued with our detailed analysis, featuring fair value estimates, potential risks, dividends, insider trades, and its financial condition.
Access Free AnalysisThis article by Simply Wall St is general in nature. It does not constitute a recommendation to buy or sell any stock, and does not take account of your objectives, or your financial situation. We aim to bring you long-term focused analysis driven by fundamental data. Note that our analysis may not factor in the latest price-sensitive company announcements or qualitative material. Simply Wall St has no position in any stocks mentioned.
*Interactive Brokers Rated Lowest Cost Broker by StockBrokers.com Annual Online Review 2020
Have feedback on this article? Concerned about the content? Get in touch with us directly. Alternatively, email editorial-team (at) simplywallst.com.
About NasdaqCM:NESR
National Energy Services Reunited
Provides oilfield services in the Middle East and North Africa region.
Flawless balance sheet and undervalued.
Similar Companies
Market Insights

Advertisement
Community Narratives
Groundbreaking therapies that could change the treatment landscape for PTSD, fibromyalgia, MS & Alzheimer’s
Fair Value US$6.20|86.9% undervalued
CM
Community Contributor
DigitalOcean Will Grow 14% by Embracing AI with Paperspace Acquisition
Fair Value US$50.00|41.7% undervalued
NE
Community Contributor
Viant Technology: A Rising AdTech Challenger in the AI-Powered CTV Market
Fair Value US$38.61|63.2% undervalued
BL
Community Contributor
Volvo will Accelerate Forward into Electric and Autonomous Leadership in Five Years
Fair Value SEK 438.80|39.7% undervalued
UN
Community Contributor