- United States
- /
- Oil and Gas
- /
- NasdaqCM:HHRS
An Intrinsic Calculation For Hammerhead Energy Inc. (NASDAQ:HHRS) Suggests It's 35% Undervalued


Key Insights
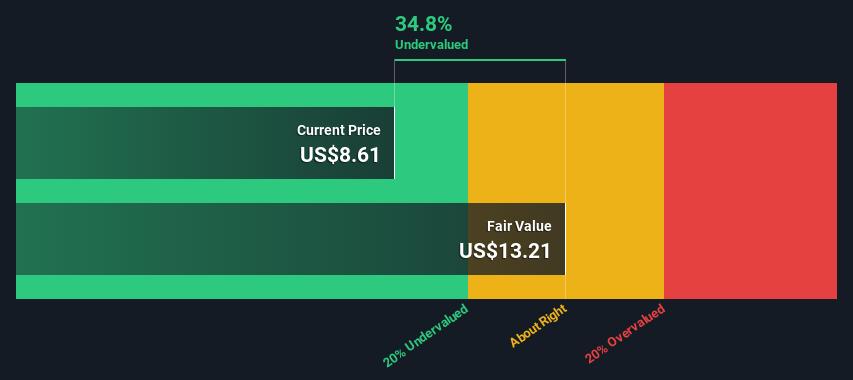
- Using the 2 Stage Free Cash Flow to Equity, Hammerhead Energy fair value estimate is US$13.21
- Hammerhead Energy is estimated to be 35% undervalued based on current share price of US$8.61
Does the July share price for Hammerhead Energy Inc. (NASDAQ:HHRS) reflect what it's really worth? Today, we will estimate the stock's intrinsic value by projecting its future cash flows and then discounting them to today's value. One way to achieve this is by employing the Discounted Cash Flow (DCF) model. Models like these may appear beyond the comprehension of a lay person, but they're fairly easy to follow.
Remember though, that there are many ways to estimate a company's value, and a DCF is just one method. Anyone interested in learning a bit more about intrinsic value should have a read of the Simply Wall St analysis model.
See our latest analysis for Hammerhead Energy
Crunching The Numbers
We are going to use a two-stage DCF model, which, as the name states, takes into account two stages of growth. The first stage is generally a higher growth period which levels off heading towards the terminal value, captured in the second 'steady growth' period. To begin with, we have to get estimates of the next ten years of cash flows. Where possible we use analyst estimates, but when these aren't available we extrapolate the previous free cash flow (FCF) from the last estimate or reported value. We assume companies with shrinking free cash flow will slow their rate of shrinkage, and that companies with growing free cash flow will see their growth rate slow, over this period. We do this to reflect that growth tends to slow more in the early years than it does in later years.
A DCF is all about the idea that a dollar in the future is less valuable than a dollar today, and so the sum of these future cash flows is then discounted to today's value:
10-year free cash flow (FCF) forecast
| 2024 | 2025 | 2026 | 2027 | 2028 | 2029 | 2030 | 2031 | 2032 | 2033 | |
| Levered FCF (CA$, Millions) | CA$43.2m | CA$63.3m | CA$84.2m | CA$104.2m | CA$122.2m | CA$137.7m | CA$150.9m | CA$161.9m | CA$171.2m | CA$179.2m |
| Growth Rate Estimate Source | Analyst x2 | Est @ 46.33% | Est @ 33.06% | Est @ 23.78% | Est @ 17.28% | Est @ 12.73% | Est @ 9.54% | Est @ 7.31% | Est @ 5.75% | Est @ 4.66% |
| Present Value (CA$, Millions) Discounted @ 9.9% | CA$39.3 | CA$52.4 | CA$63.4 | CA$71.4 | CA$76.2 | CA$78.2 | CA$77.9 | CA$76.1 | CA$73.2 | CA$69.7 |
("Est" = FCF growth rate estimated by Simply Wall St)
Present Value of 10-year Cash Flow (PVCF) = CA$678m
The second stage is also known as Terminal Value, this is the business's cash flow after the first stage. The Gordon Growth formula is used to calculate Terminal Value at a future annual growth rate equal to the 5-year average of the 10-year government bond yield of 2.1%. We discount the terminal cash flows to today's value at a cost of equity of 9.9%.
Terminal Value (TV)= FCF2033 × (1 + g) ÷ (r – g) = CA$179m× (1 + 2.1%) ÷ (9.9%– 2.1%) = CA$2.3b
Present Value of Terminal Value (PVTV)= TV / (1 + r)10= CA$2.3b÷ ( 1 + 9.9%)10= CA$914m
The total value is the sum of cash flows for the next ten years plus the discounted terminal value, which results in the Total Equity Value, which in this case is CA$1.6b. To get the intrinsic value per share, we divide this by the total number of shares outstanding. Compared to the current share price of US$8.6, the company appears quite good value at a 35% discount to where the stock price trades currently. Valuations are imprecise instruments though, rather like a telescope - move a few degrees and end up in a different galaxy. Do keep this in mind.
Important Assumptions
Now the most important inputs to a discounted cash flow are the discount rate, and of course, the actual cash flows. If you don't agree with these result, have a go at the calculation yourself and play with the assumptions. The DCF also does not consider the possible cyclicality of an industry, or a company's future capital requirements, so it does not give a full picture of a company's potential performance. Given that we are looking at Hammerhead Energy as potential shareholders, the cost of equity is used as the discount rate, rather than the cost of capital (or weighted average cost of capital, WACC) which accounts for debt. In this calculation we've used 9.9%, which is based on a levered beta of 1.311. Beta is a measure of a stock's volatility, compared to the market as a whole. We get our beta from the industry average beta of globally comparable companies, with an imposed limit between 0.8 and 2.0, which is a reasonable range for a stable business.
Looking Ahead:
Valuation is only one side of the coin in terms of building your investment thesis, and it shouldn't be the only metric you look at when researching a company. The DCF model is not a perfect stock valuation tool. Preferably you'd apply different cases and assumptions and see how they would impact the company's valuation. For example, changes in the company's cost of equity or the risk free rate can significantly impact the valuation. Why is the intrinsic value higher than the current share price? For Hammerhead Energy, we've compiled three further aspects you should consider:
- Financial Health: Does HHRS have a healthy balance sheet? Take a look at our free balance sheet analysis with six simple checks on key factors like leverage and risk.
- Future Earnings: How does HHRS's growth rate compare to its peers and the wider market? Dig deeper into the analyst consensus number for the upcoming years by interacting with our free analyst growth expectation chart.
- Other High Quality Alternatives: Do you like a good all-rounder? Explore our interactive list of high quality stocks to get an idea of what else is out there you may be missing!
PS. The Simply Wall St app conducts a discounted cash flow valuation for every stock on the NASDAQCM every day. If you want to find the calculation for other stocks just search here.
Valuation is complex, but we're here to simplify it.
Discover if Hammerhead Energy might be undervalued or overvalued with our detailed analysis, featuring fair value estimates, potential risks, dividends, insider trades, and its financial condition.
Access Free AnalysisHave feedback on this article? Concerned about the content? Get in touch with us directly. Alternatively, email editorial-team (at) simplywallst.com.
This article by Simply Wall St is general in nature. We provide commentary based on historical data and analyst forecasts only using an unbiased methodology and our articles are not intended to be financial advice. It does not constitute a recommendation to buy or sell any stock, and does not take account of your objectives, or your financial situation. We aim to bring you long-term focused analysis driven by fundamental data. Note that our analysis may not factor in the latest price-sensitive company announcements or qualitative material. Simply Wall St has no position in any stocks mentioned.
About NasdaqCM:HHRS
Hammerhead Energy
Hammerhead Energy Inc. operates as an oil and gas company that develops multi-zone liquids-rich oil and gas properties in the Alberta Montney.
Good value with mediocre balance sheet.
Market Insights

Community Narratives

