Advertisement
- United States
- /
- Energy Services
- /
- NasdaqGS:BKR
Rethinking Baker Hughes After Shares Surge and $1.5B Qatari LNG Contract in 2025

Simply Wall St
Reviewed by Bailey Pemberton
If you are wondering what to do next with Baker Hughes stock, you are not alone. After all, shares have been on a bit of a roller coaster recently, dipping 4.0% in the last week, but still gaining an impressive 7.8% over the past month, and rising a strong 16.7% year-to-date. Over longer periods the gains are even more striking, with a remarkable 30.7% jump in the last year and eye-popping 320.4% growth over five years. With that kind of track record, it is natural to ask whether this is a stock running ahead of its value or if there is still room to grow.
Much of Baker Hughes’ price action reflects shifting investor sentiment around global energy demand and an evolving energy landscape. As the market has factored in recent developments, risk perception has shifted at times, but the company’s long-term story is all about steady, compounding progress. But does this track record mean the shares are a bargain, or does the price already reflect the company’s prospects?
To answer that, it helps to put some numbers on Baker Hughes’ current value. Using a value score system that adds up six possible checks for being undervalued, Baker Hughes scores a 2 out of 6, suggesting it only gets credit on two key valuation measures right now. Of course, just ticking boxes might not tell the whole story. Let's break down these valuation approaches together, then look at an even more insightful way to assess Baker Hughes by the end of this article.
Baker Hughes scores just 2/6 on our valuation checks. See what other red flags we found in the full valuation breakdown.
Approach 1: Baker Hughes Discounted Cash Flow (DCF) Analysis
The Discounted Cash Flow (DCF) valuation method estimates a company's value by forecasting its future cash flows and then discounting those back to their present value. For Baker Hughes, this approach uses the 2 Stage Free Cash Flow to Equity model, which considers both near-term analyst projections and longer-term extrapolated estimates.
Baker Hughes currently generates Free Cash Flow (FCF) of approximately $2.1 Billion. Analysts predict that this figure will steadily rise, reaching about $3.0 Billion by 2029. Estimates beyond the five-year analyst horizon are extrapolated, with Simply Wall St projecting FCF to continue growing throughout the next decade. All figures are in U.S. dollars.
Based on these cumulative cash flows, the DCF model calculates the company’s intrinsic value at $59.81 per share. This represents an 18.9% discount compared to the current market price, suggesting the stock may be undervalued on this basis.
Result: UNDERVALUED
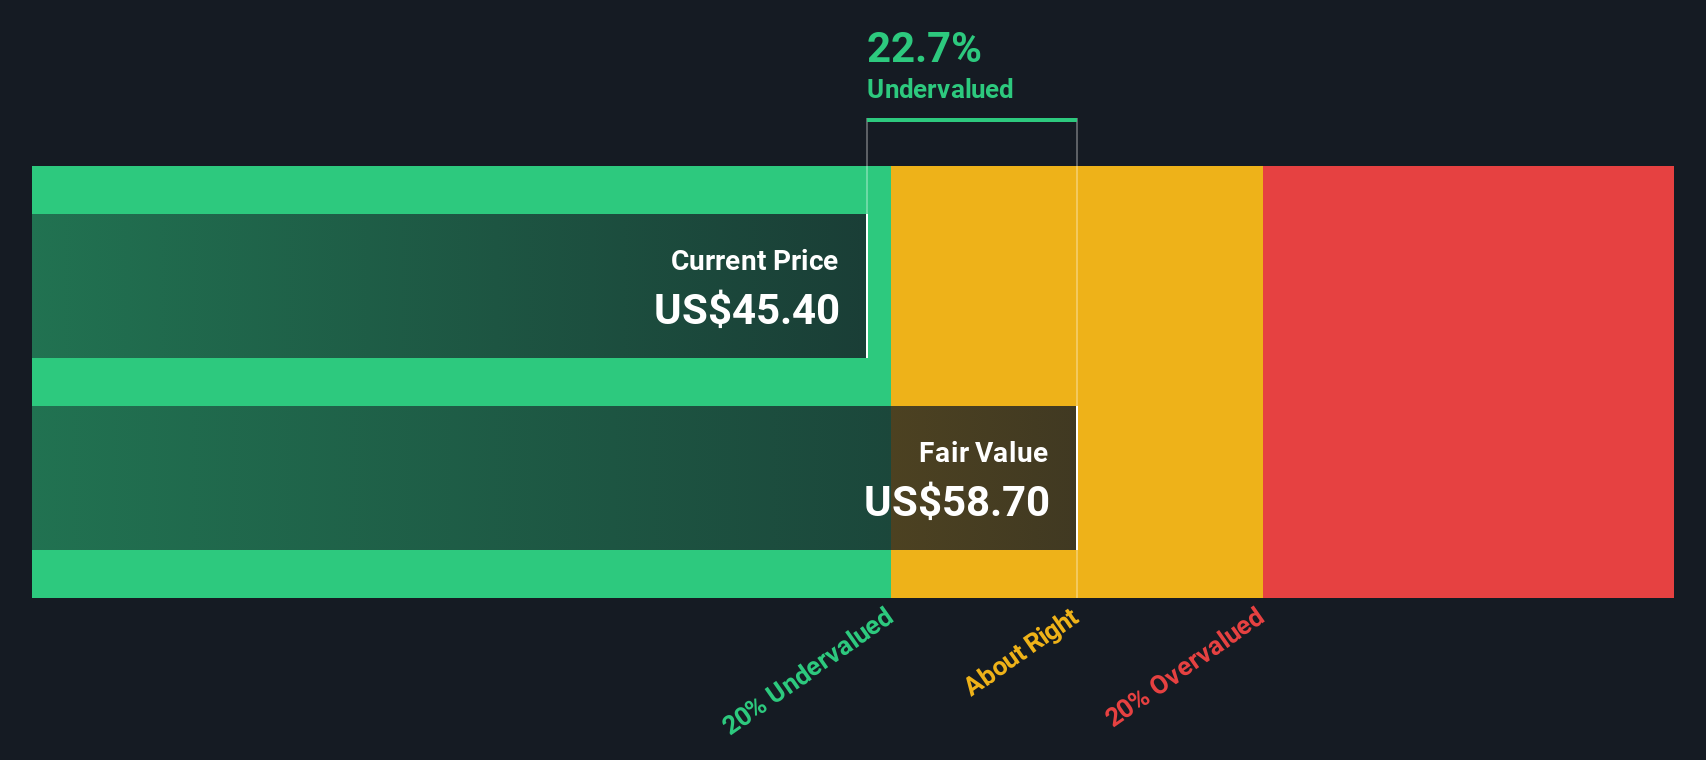
Our Discounted Cash Flow (DCF) analysis suggests Baker Hughes is undervalued by 18.9%. Track this in your watchlist or portfolio, or discover more undervalued stocks.
Approach 2: Baker Hughes Price vs Earnings
The Price-to-Earnings (PE) ratio is a widely used valuation measure for profitable companies like Baker Hughes, as it directly compares the market price of the stock with its underlying earnings. This makes it particularly suitable for mature companies where consistent profits provide a clear baseline for comparison. Typically, higher PE ratios are justified for companies with strong growth prospects or lower risks, while a lower PE can signal higher risk or subdued growth expectations.
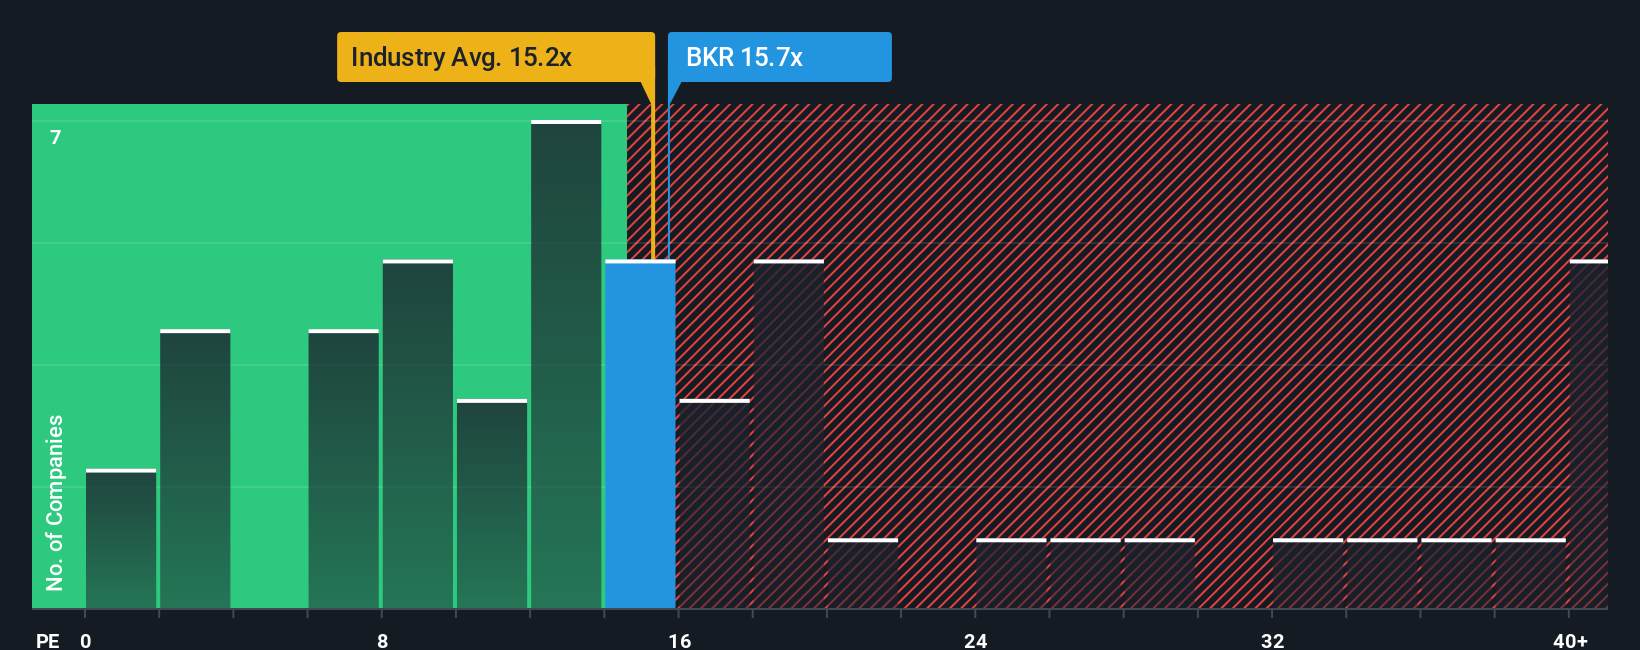
Baker Hughes currently trades at a PE ratio of 15.7x. In context, this figure is slightly above the industry average of 15.2x and noticeably higher than the peer average of 12.8x. At first glance, Baker Hughes may appear somewhat more expensive than immediate competitors, but these basic averages do not account for the company's unique growth potential, profitability, or risk profile.
To address these limitations, Simply Wall St’s proprietary “Fair Ratio” incorporates factors such as earnings growth, profit margins, industry conditions, market capitalization, and business risks to determine what PE ratio is justified for a company like Baker Hughes. This tailored benchmark, at 16.9x, offers a more accurate baseline than generic peer or industry averages, reflecting the company’s specific strengths and risks.
With a current PE of 15.7x compared to a Fair Ratio of 16.9x, Baker Hughes appears to be priced appropriately. The small gap between these numbers suggests that the stock valuation is reasonable given its growth and risk factors.
Result: ABOUT RIGHT
PE ratios tell one story, but what if the real opportunity lies elsewhere? Discover companies where insiders are betting big on explosive growth.
Upgrade Your Decision Making: Choose your Baker Hughes Narrative
Earlier we mentioned that there's an even better way to understand valuation, so let's introduce you to Narratives. A Narrative is your own perspective on a company, the story you believe sits behind the numbers, that connects your assumptions about Baker Hughes’ future revenues, margins, and risks to a specific fair value estimate.
Narratives bridge the gap between a company’s journey in the real world, robust financial projections, and what you think its shares are truly worth. They offer a structured way to document and share your thinking. Available to millions of investors on Simply Wall St’s Community page, Narratives make it easy for you to shape your personal view, see how it affects Fair Value, and instantly compare it to the current share price to make informed buy or sell decisions.
Plus, as fresh earnings are released or major news breaks, Narratives are updated automatically, keeping your analysis dynamic and relevant. For example, on Baker Hughes, a bullish investor may see opportunity in new energy expansion and set a high price target of $60, while a cautious peer might focus on oil market dependency and target just $37. Narratives let you track both optimistic and conservative views and quickly test your own assumptions, all with a clear link to fair value and action.
Do you think there's more to the story for Baker Hughes? Create your own Narrative to let the Community know!
This article by Simply Wall St is general in nature. We provide commentary based on historical data and analyst forecasts only using an unbiased methodology and our articles are not intended to be financial advice. It does not constitute a recommendation to buy or sell any stock, and does not take account of your objectives, or your financial situation. We aim to bring you long-term focused analysis driven by fundamental data. Note that our analysis may not factor in the latest price-sensitive company announcements or qualitative material. Simply Wall St has no position in any stocks mentioned.
Valuation is complex, but we're here to simplify it.
Discover if Baker Hughes might be undervalued or overvalued with our detailed analysis, featuring fair value estimates, potential risks, dividends, insider trades, and its financial condition.
Access Free AnalysisHave feedback on this article? Concerned about the content? Get in touch with us directly. Alternatively, email editorial-team@simplywallst.com
About NasdaqGS:BKR
Baker Hughes
Provides a portfolio of technologies and services to energy and industrial value chain worldwide.
Flawless balance sheet with proven track record.
Similar Companies
Market Insights

Advertisement
Community Narratives
The Next Phase of Energy Storage: How NeoVolta Is Tackling America’s Power Crunch
Fair Value US$7.50|35.1% undervalued
MA
Community Contributor
Why EnSilica is Worth Possibly 13x its Current Price
Fair Value UK£5.00|89.8% undervalued
DO
Community Contributor
M&A Activity, Industry Diversification & A Defense Contract Monopoly Will Push BWXT For Healthy Long-Term Growth
Fair Value US$220.00|15.2% undervalued
CL
Community Contributor
A case for Cassiar Gold Corp (TSXV: GLDC) to reach CAD$8-10 before 2030 (X30-37)
Fair Value CA$10.00|96.0% undervalued
AG
Community Contributor