- United States
- /
- Diversified Financial
- /
- NYSE:RDN
Radian Group (RDN) Value Discount Persists as Margin Compression Challenges Bullish Narratives

Reviewed by Simply Wall St
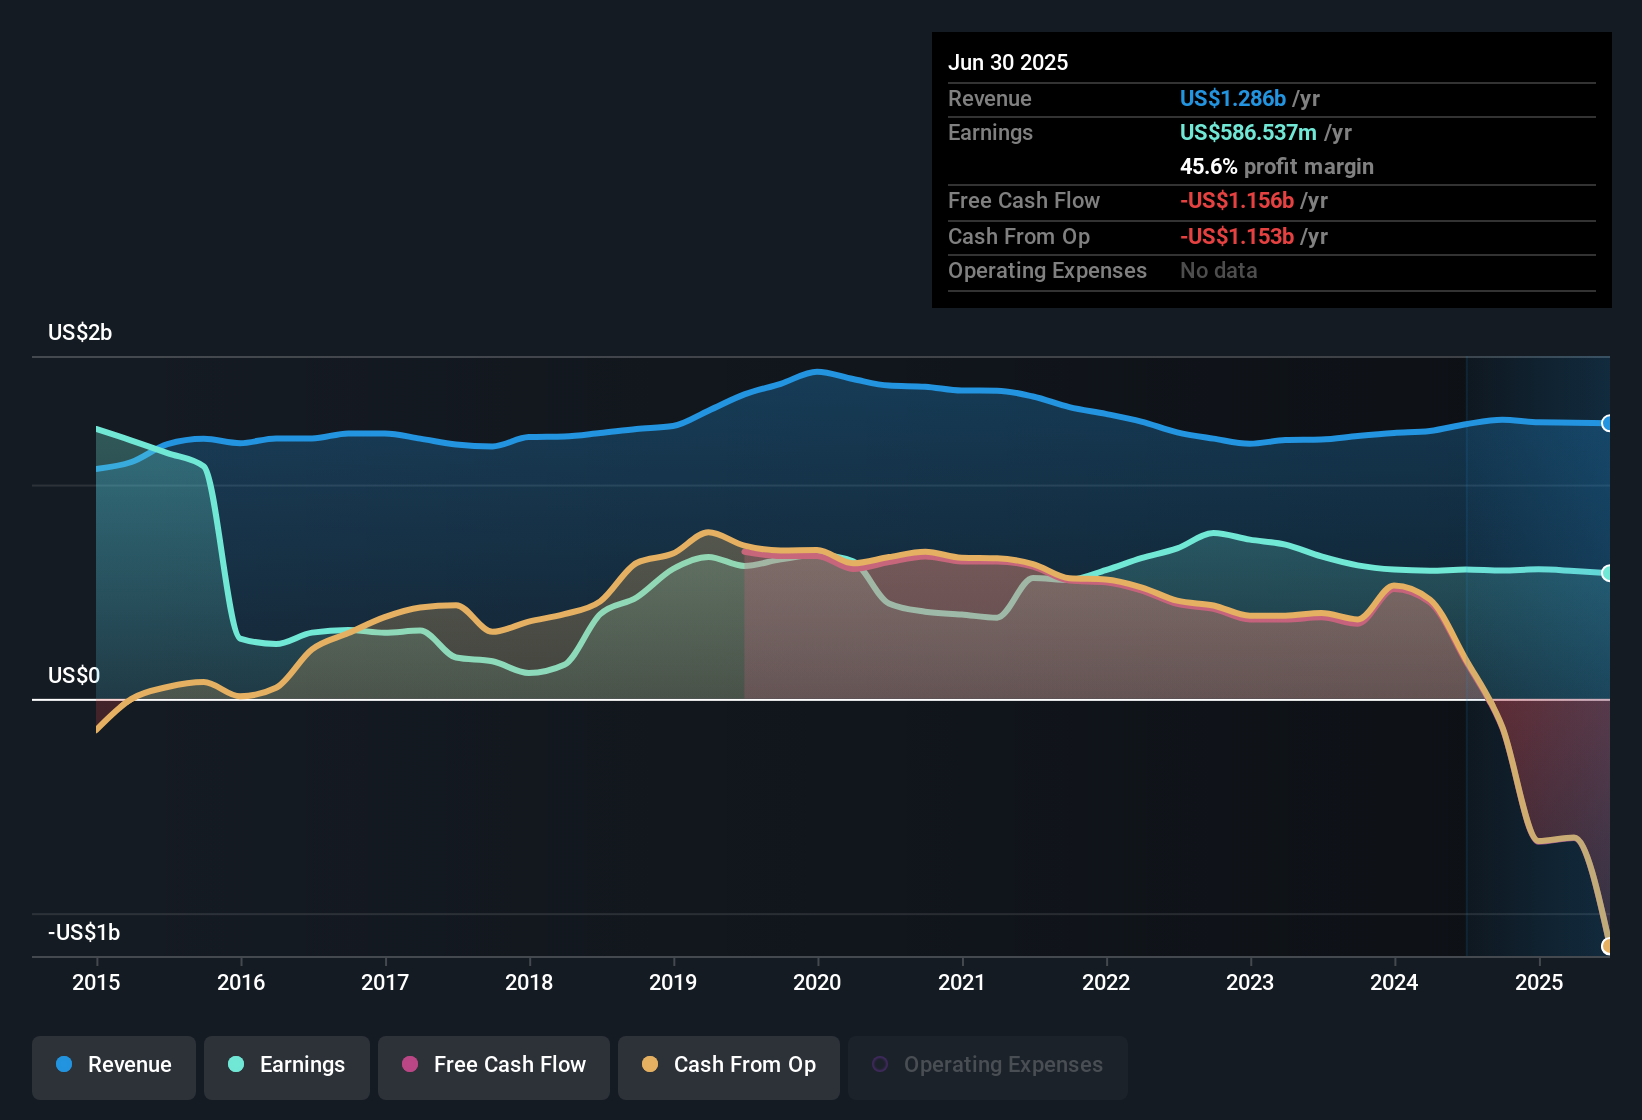
Radian Group (RDN) posted annual earnings growth of 5.1% over the past five years, but its earnings slipped over the last year and are projected to rise only 3.7% annually going forward. Revenue is on track to grow at 6.5% each year, trailing the US market average of 10.5%. The recent net profit margin came in at 45.6%, down from 47.1% last year. Investors may see the lower price-to-earnings ratio of 7.9x as a value opportunity versus its peers. However, growth prospects appear more modest and risks around dividend sustainability and financial strength should be weighed.
See our full analysis for Radian Group.Next, we’ll compare these headline results to the narratives investors are following, highlighting where the consensus matches reality and where expectations might need a rethink.
See what the community is saying about Radian Group
Margin Compression Continues Into 2024
- Analysts expect Radian's net profit margin to fall from 45.6% now to 37.7% in three years, signaling a significant contraction that will impact future profitability.
- According to the analysts' consensus view, operational efficiency and data-driven risk management are credited for keeping net margins relatively high today. However,
- margins are still projected to shrink as rising costs and mortgage insurance dependency outpace gains from efficiency initiatives, challenging the idea of sustained earnings quality,
- and ongoing operating losses in non-core segments have yet to reverse, suggesting further margin pressure ahead even as headline figures remain stronger than many peers.
Shares Outstanding Set To Drop
- Radian is forecast to reduce its number of shares outstanding by 7.0% annually over the next three years, a material buyback pace that could support per-share metrics even as overall earnings growth slows.
- Analysts' consensus narrative notes that robust liquidity and capital allocation discipline allow for aggressive share repurchases. As a result,
- share reduction may help offset pressures from forecast lower margins and tepid revenue growth,
- though the benefit is partially balanced by ongoing earnings declines and limited diversification, leaving shareholders reliant on buybacks rather than new sources of expansion.
Discounted Valuation Versus Industry
- Radian trades on a price-to-earnings ratio of 7.9x versus the US Diversified Financial industry average of 15x, and below its peer group at 9.4x, highlighting a notable valuation discount that investors may see as a safety margin.
- In line with the consensus narrative, this discount reflects mixed growth prospects:
- revenue and earnings are lagging market averages, keeping the multiple low even as value-oriented investors look for upside in further margin of safety,
- while the small gap between the analyst target ($38.83) and the current share price ($34.01) signals that, despite the valuation gap, most observers see Radian as fairly valued rather than deeply mispriced.
Next Steps
To see how these results tie into long-term growth, risks, and valuation, check out the full range of community narratives for Radian Group on Simply Wall St. Add the company to your watchlist or portfolio so you'll be alerted when the story evolves.
Have a different take on the figures? In just a few minutes, you can build your own assessment and share a fresh perspective. Do it your way
A great starting point for your Radian Group research is our analysis highlighting 3 key rewards and 2 important warning signs that could impact your investment decision.
See What Else Is Out There
Radian faces shrinking margins and slowing earnings growth, leaving investors exposed to mounting operational pressures and ongoing financial strength challenges.
If you see these vulnerabilities as red flags, focus your strategy on companies with robust finances and stability by searching for solid balance sheet and fundamentals stocks screener (1979 results) positioned to weather uncertainty.
This article by Simply Wall St is general in nature. We provide commentary based on historical data and analyst forecasts only using an unbiased methodology and our articles are not intended to be financial advice. It does not constitute a recommendation to buy or sell any stock, and does not take account of your objectives, or your financial situation. We aim to bring you long-term focused analysis driven by fundamental data. Note that our analysis may not factor in the latest price-sensitive company announcements or qualitative material. Simply Wall St has no position in any stocks mentioned.
Mobile Infrastructure for Defense and Disaster
The next wave in robotics isn't humanoid. Its fully autonomous towers delivering 5G, ISR, and radar in under 30 minutes, anywhere.
Get the investor briefing before the next round of contracts
Sponsored On Behalf of CiTechNew: AI Stock Screener & Alerts
Our new AI Stock Screener scans the market every day to uncover opportunities.
• Dividend Powerhouses (3%+ Yield)
• Undervalued Small Caps with Insider Buying
• High growth Tech and AI Companies
Or build your own from over 50 metrics.
Have feedback on this article? Concerned about the content? Get in touch with us directly. Alternatively, email editorial-team@simplywallst.com
About NYSE:RDN
Radian Group
Engages in the mortgage and real estate services business in the United States.
Undervalued with excellent balance sheet and pays a dividend.
Market Insights

Weekly Picks

Early mover in a fast growing industry. Likely to experience share price volatility as they scale


A case for CA$31.80 (undiluted), aka 8,616% upside from CA$0.37 (an 86 bagger!).


Moderation and Stabilisation: HOLD: Fair Price based on a 4-year Cycle is $12.08
Recently Updated Narratives


Positioned to Win as the Streaming Wars Settle

Meta’s Bold Bet on AI Pays Off

ADP Stock: Solid Fundamentals, But AI Investments Test Its Margin Resilience
Popular Narratives


Crazy Undervalued 42 Baggers Silver Play (Active & Running Mine)


NVDA: Expanding AI Demand Will Drive Major Data Center Investments Through 2026

The AI Infrastructure Giant Grows Into Its Valuation
Trending Discussion

