Advertisement
- United States
- /
- Capital Markets
- /
- NYSE:OWL
Examining Blue Owl’s Valuation After a 27% Year-to-Date Decline in 2025

Simply Wall St
Reviewed by Bailey Pemberton
Thinking about what to do with your Blue Owl Capital shares, or considering taking a fresh look at this dynamic asset manager? You are not alone. After all, Blue Owl’s stock price journey has given investors plenty to talk about lately. The last close sat at $17.17, but if you zoom out, the short-term picture shows just a 0.3% gain this past week, while the past month brought a drop of 7.3%. Long-term holders have seen both sides of the coin: a powerful 97% gain over three years, countered by a 27.2% decline year-to-date and a 22.6% dip over the past twelve months. It has been a period of recalibration as investors react to both sector shifts and developments unique to Blue Owl.
In recent months, much of Blue Owl’s narrative has focused on its growing footprint in the alternative asset space, with expansions and partnerships grabbing headlines. The market is weighing these moves and recalculating assumptions about risk, scalability, and future inflows, even as volatility has crept higher across financial stocks. While the company has certainly captured attention as a rising star among asset managers, investors are watching to see if this momentum translates into sustained shareholder value.
On the valuation front, Blue Owl Capital currently scores a 1 out of 6 on our undervaluation checklist, meaning that only one valuation metric points toward the stock being undervalued right now. But before we rely too heavily on numbers alone, let us dig deeper into the main approaches to valuation. Stay with me for an even smarter angle on judging value coming up at the end of this article.
Blue Owl Capital scores just 1/6 on our valuation checks. See what other red flags we found in the full valuation breakdown.
Approach 1: Blue Owl Capital Excess Returns Analysis
The Excess Returns model assesses how efficiently Blue Owl Capital puts its investors’ money to work by measuring returns generated above its cost of equity. In other words, this approach zeros in on whether the company’s capital investments produce more profit than the minimum expected by shareholders.
For Blue Owl Capital, the numbers paint a succinct picture. The company’s average return on equity over the past five years was 3.98%, with a stable earnings per share figure of $0.14. With a book value per share of $3.61 and a stable book value of $3.53, the business is working with a cost of equity estimated at $0.30 per share. The resulting excess return, which tells us if Blue Owl is producing value above its cost of equity, comes in negative at $-0.16 per share. Simply put, according to this model, Blue Owl is not currently beating its cost of capital, an important benchmark for long-term value creation.
The intrinsic value per share implied by this model is $0.60, a huge drop from the latest market price of $17.17. That translates to the stock trading around 2784.5% above the value suggested by the company’s excess returns. Based on this view, Blue Owl Capital looks vastly overvalued and may not offer a margin of safety for value-minded investors at current prices.
Result: OVERVALUED
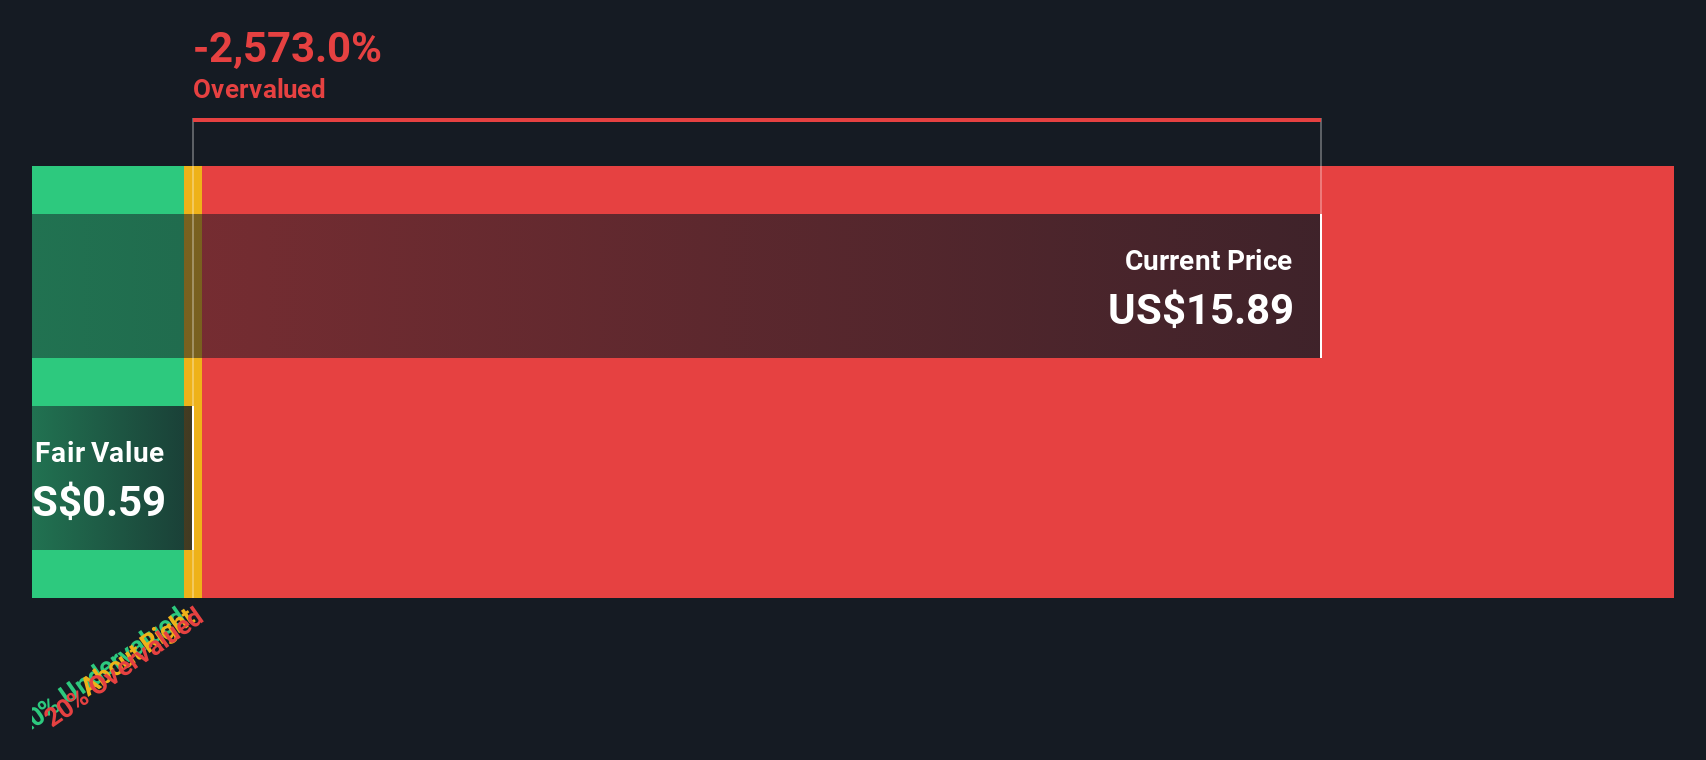
Our Excess Returns analysis suggests Blue Owl Capital may be overvalued by 2784.5%. Find undervalued stocks or create your own screener to find better value opportunities.
Approach 2: Blue Owl Capital Price vs Earnings
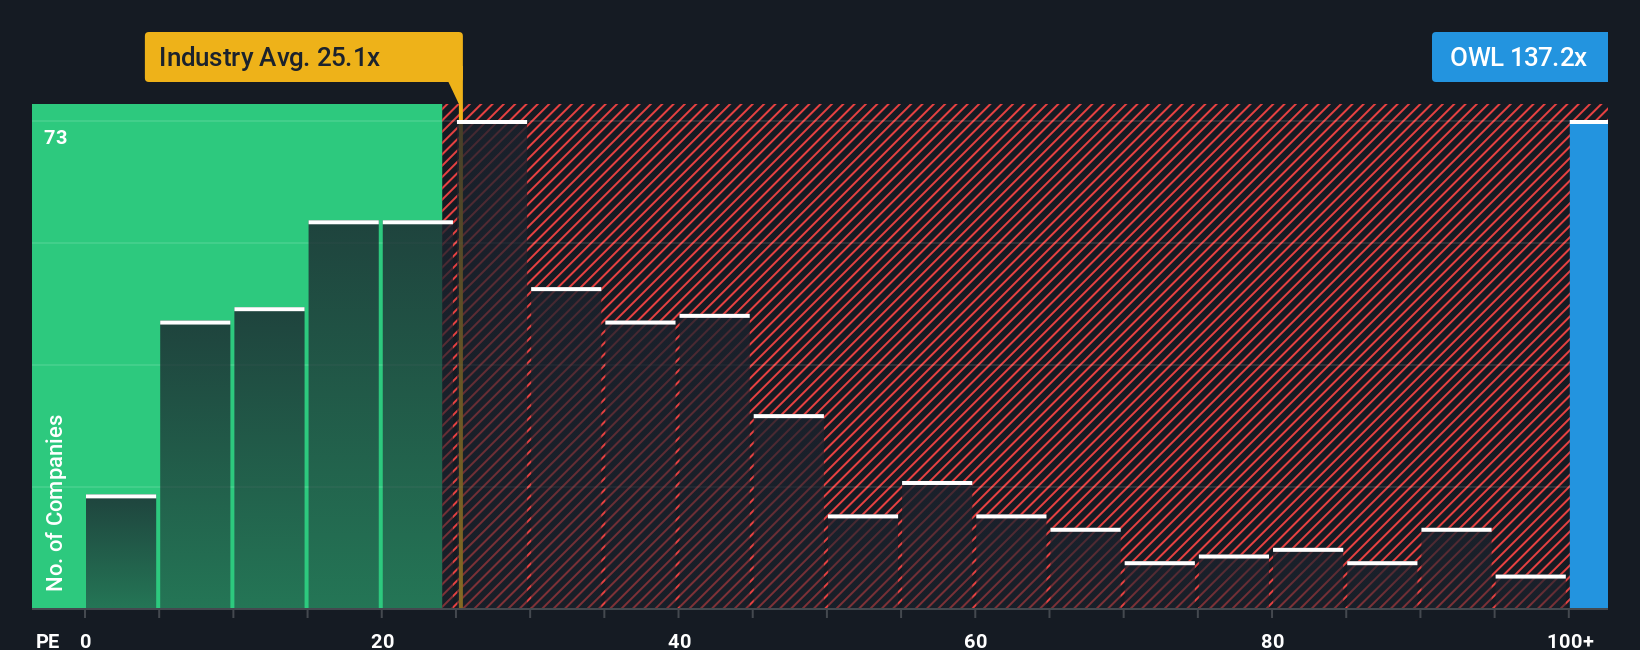
For profitable companies like Blue Owl Capital, the Price-to-Earnings (PE) ratio is a preferred metric because it provides a direct view of how much investors are willing to pay for each dollar of current earnings. Since earnings capture profitability, the PE ratio helps shed light on valuations in a way that other multiples cannot.
A company’s “normal” or “fair” PE ratio will depend on several elements, with growth expectations and risk being the most influential. Generally, faster-growing and less risky companies command higher PE ratios, while slower-growing or riskier companies receive lower multiples.
Blue Owl Capital’s current PE ratio stands at 148.26x, which is far above the Capital Markets industry average of 25.93x and the peer average of 13.48x. While these comparisons set the context, evaluating a stock’s valuation demands a more tailored approach. That is where the “Fair Ratio” comes in. Simply Wall St’s Fair Ratio for Blue Owl is 52.37x, which reflects key company characteristics such as growth prospects, profit margins, risk profile, and even market cap. This delivers a more nuanced and accurate benchmark than industry or peer numbers alone.
Comparing the Fair Ratio to Blue Owl’s actual PE makes it clear that the shares are trading well above what would be justified by these fundamentals, suggesting the stock may be richly valued based on earnings.
Result: OVERVALUED
PE ratios tell one story, but what if the real opportunity lies elsewhere? Discover companies where insiders are betting big on explosive growth.
Upgrade Your Decision Making: Choose your Blue Owl Capital Narrative
Earlier, we mentioned there is an even better way to understand valuation, so let's introduce you to Narratives, a feature on Simply Wall St that lets you connect your view of a company’s story with the actual numbers behind its financial future.
A Narrative is simply your perspective, backed by your assumptions about a company’s growth, risks, and opportunities, that turns headlines and analysis into a concrete financial forecast and an estimate of fair value. Rather than relying only on standard valuation ratios, Narratives empower you to link real-world trends or business changes with your own estimates for future revenue, profit margins, or market risks. This allows you to instantly see what that means for fair value versus the current price.
These Narratives are available within the Community page on Simply Wall St, making it easy for investors at any level to test their thinking, share insights, and revisit their view as the facts change. Whenever new news or earnings are released, Narratives update automatically so your assumptions stay current without extra work.
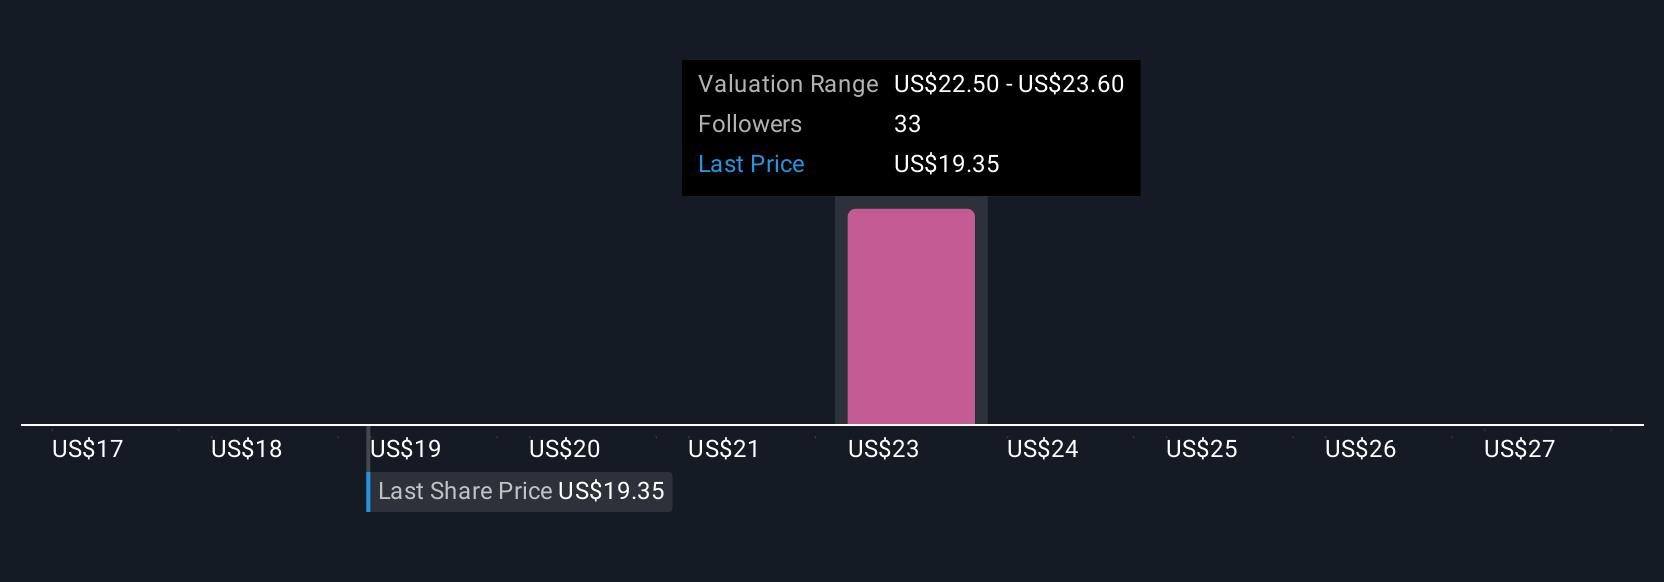
For Blue Owl Capital, some investors see strong future growth from digital infrastructure, leading them to a fair value as high as $29.00. Others focus on risks like increased competition and assign a more cautious value of $21.00. With Narratives, you can confidently build and refine your own view alongside the rest of the community.
Do you think there's more to the story for Blue Owl Capital? Create your own Narrative to let the Community know!
This article by Simply Wall St is general in nature. We provide commentary based on historical data and analyst forecasts only using an unbiased methodology and our articles are not intended to be financial advice. It does not constitute a recommendation to buy or sell any stock, and does not take account of your objectives, or your financial situation. We aim to bring you long-term focused analysis driven by fundamental data. Note that our analysis may not factor in the latest price-sensitive company announcements or qualitative material. Simply Wall St has no position in any stocks mentioned.
Valuation is complex, but we're here to simplify it.
Discover if Blue Owl Capital might be undervalued or overvalued with our detailed analysis, featuring fair value estimates, potential risks, dividends, insider trades, and its financial condition.
Access Free AnalysisHave feedback on this article? Concerned about the content? Get in touch with us directly. Alternatively, email editorial-team@simplywallst.com
About NYSE:OWL
Blue Owl Capital
Operates as an alternative asset manager in the United States.
High growth potential with adequate balance sheet.
Similar Companies
Market Insights

Advertisement
Community Narratives
Finding The True Value Of A Logistics Powerhouse
Fair Value US$95.21|8.5% undervalued
NV
Community Contributor
Paradigm Biopharmaceuticals Will Lead Osteoarthritis Treatment with Zilosul's FDA Success
Fair Value AU$5.50|91.9% undervalued
AM
Community Contributor
Barrick Mining (ABX:CA): A Gold Hedge against a U.S. Shutdown
Fair Value CA$60.00|26.5% undervalued
GM
Community Contributor