Advertisement
- United States
- /
- Consumer Finance
- /
- NYSE:NNI
A Look at Nelnet’s (NNI) Valuation After Strong Q3 Earnings and Dividend Hike

Simply Wall St
Reviewed by Simply Wall St
Nelnet (NNI) just posted a surge in third-quarter earnings, with net income and earnings per share climbing sharply from the prior year. In addition to the results, the company also raised its quarterly cash dividend.
See our latest analysis for Nelnet.
This round of upbeat news comes after a strong run for Nelnet, as its share price has advanced more than 22% so far in 2025 and its total shareholder return over the past year is nearly 20%. The company’s improved outlook and rising dividend have helped fuel investor momentum in the face of recent volatility. The long-term total return of almost 100% over five years speaks to its resilience and growth potential.
If you’re curious to see what else is capturing investors’ attention, this is a great time to broaden your search and discover fast growing stocks with high insider ownership
With shares gaining ground and financial results outpacing expectations, the key question now is whether Nelnet’s stock still offers room for upside or if the market has already priced in this wave of growth.
Price-to-Earnings of 10.7x: Is it justified?
Nelnet's stock currently trades at a price-to-earnings (P/E) ratio of 10.7x, just above the US Consumer Finance industry average of 10.6x. Its last close was $129.20, placing the company at a modest premium to sector peers but below the US market average P/E of 18.2x.
The price-to-earnings ratio measures how much investors are willing to pay today for a dollar of the company's reported earnings. For financial firms like Nelnet, the P/E is a key yardstick, reflecting both profitability and growth expectations in a sector known for earnings volatility.
In Nelnet's case, the P/E looks reasonable against a backdrop of robust trailing earnings growth. Its 284% earnings surge over the past year far outpaced both its industry and the broader US market. However, the premium versus other Consumer Finance stocks is marginal. The market recognizes the massive earnings jump, yet future expectations may be tempered by anticipated revenue declines and sector headwinds.
Compared with its core industry, Nelnet’s P/E ratio is almost perfectly aligned. This suggests little room for further re-rating unless growth surprises continue. It is valued well below its peer average of 35x, which points to selective optimism rather than broad-based exuberance.
See what the numbers say about this price — find out in our valuation breakdown.
Result: Price-to-Earnings of 10.7x (ABOUT RIGHT)
However, revenue growth has turned slightly negative, and a discounted share price may signal market caution about the sustainability of recent earnings gains.
Find out about the key risks to this Nelnet narrative.
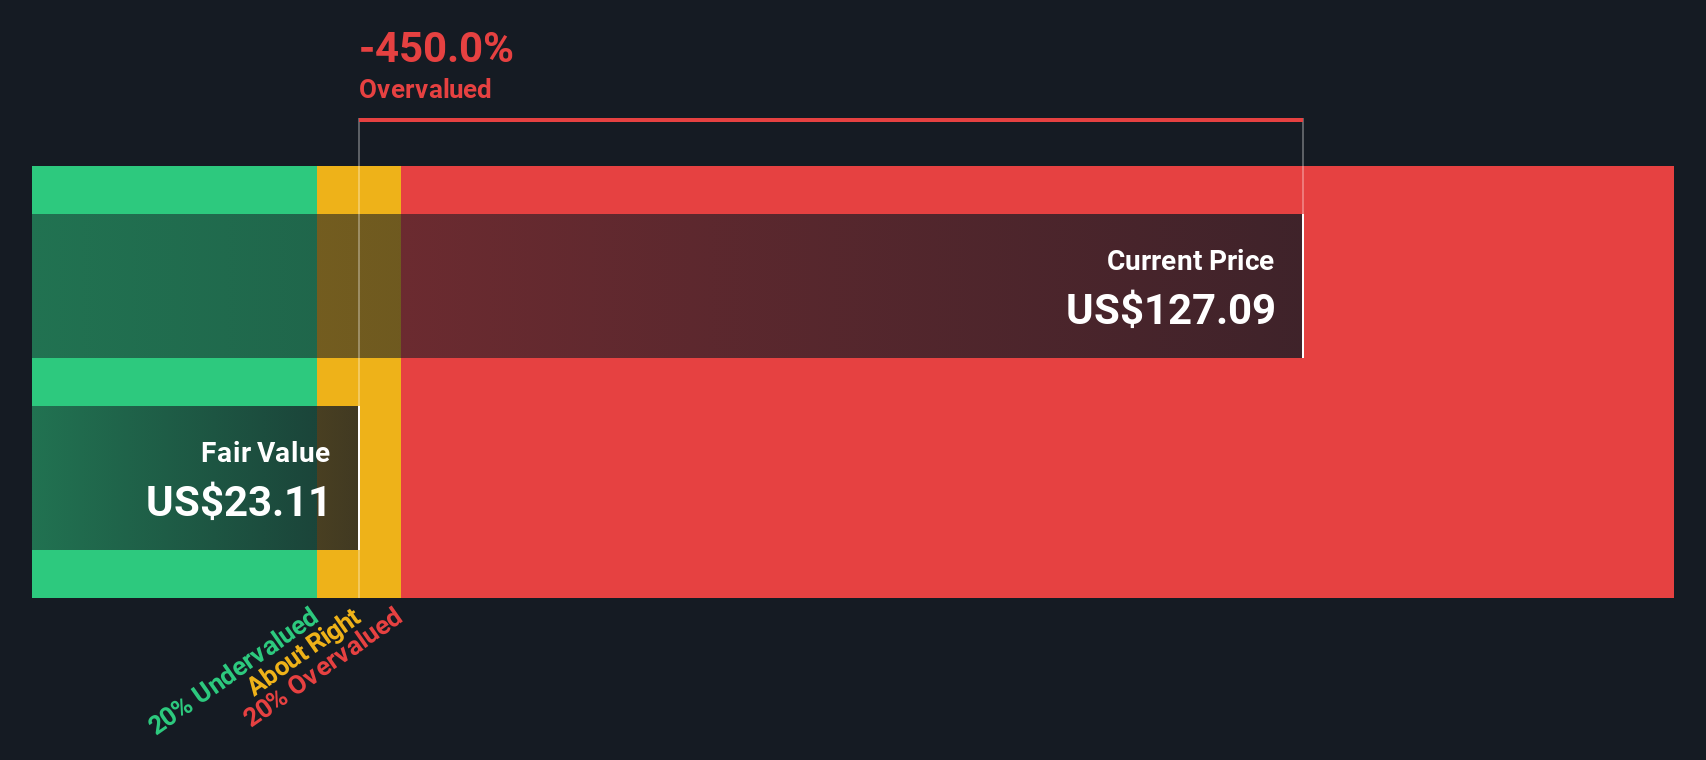
Another View: Discounted Cash Flow Tells a Different Story
While the price-to-earnings ratio suggests Nelnet is valued fairly versus peers, our DCF model presents a much more cautious outlook. The SWS DCF model estimates the fair value at just $22.79, far below the current share price. This signals potential overvaluation if the model’s assumptions hold true. Is the market overlooking real risks, or are the numbers missing something?
Look into how the SWS DCF model arrives at its fair value.
Simply Wall St performs a discounted cash flow (DCF) on every stock in the world every day (check out Nelnet for example). We show the entire calculation in full. You can track the result in your watchlist or portfolio and be alerted when this changes, or use our stock screener to discover 879 undervalued stocks based on their cash flows. If you save a screener we even alert you when new companies match - so you never miss a potential opportunity.
Build Your Own Nelnet Narrative
Don’t see eye to eye with these numbers, or want to put your own spin on the story? With just a few minutes, you can dig into the data yourself and shape your own view. Do it your way
A great starting point for your Nelnet research is our analysis highlighting 2 key rewards and 2 important warning signs that could impact your investment decision.
Ready for More Smart Investment Ideas?
Smart investors always widen their lens. Don’t leave your next breakthrough investment to chance. See which stocks are riding powerful trends right now using our top screeners below.
- Boost your income by targeting stable companies with consistent payouts using these 16 dividend stocks with yields > 3%, offering yields above 3%.
- Position yourself at the forefront of healthcare innovation by following these 31 healthcare AI stocks, shaping the future of medical technology.
- Uncover value picks trading below their intrinsic worth with these 879 undervalued stocks based on cash flows and seize opportunities most investors overlook.
This article by Simply Wall St is general in nature. We provide commentary based on historical data and analyst forecasts only using an unbiased methodology and our articles are not intended to be financial advice. It does not constitute a recommendation to buy or sell any stock, and does not take account of your objectives, or your financial situation. We aim to bring you long-term focused analysis driven by fundamental data. Note that our analysis may not factor in the latest price-sensitive company announcements or qualitative material. Simply Wall St has no position in any stocks mentioned.
Valuation is complex, but we're here to simplify it.
Discover if Nelnet might be undervalued or overvalued with our detailed analysis, featuring fair value estimates, potential risks, dividends, insider trades, and its financial condition.
Access Free AnalysisHave feedback on this article? Concerned about the content? Get in touch with us directly. Alternatively, email editorial-team@simplywallst.com
About NYSE:NNI
Nelnet
Engages in loan servicing, education technology services, and payment businesses worldwide.
Proven track record average dividend payer.
Similar Companies
Market Insights

Advertisement
Community Narratives
MINISO's fair value is projected at 26.69 with an anticipated PE ratio shift of 20x
Fair Value US$24.03|11.0% undervalued
BE
Community Contributor
Procter & Gamble: A Dividend Giant Facing Slowing Growth
Fair Value US$119.81|23.3% overvalued
AN
Community Contributor
Eli Lilly's Future Growth Driven by Tirzepatide and Favorable Market Conditions
Fair Value US$1.19k|13.8% undervalued
EA
Community Contributor