Advertisement
- United States
- /
- Capital Markets
- /
- NYSE:JEF
Assessing Jefferies After a 21% Decline and Amid Financial Sector Volatility in 2025

Simply Wall St
Reviewed by Bailey Pemberton
Thinking about whether to stick with Jefferies Financial Group or make it a new addition to your portfolio? You’re not alone. The financial world keeps a sharp eye on companies that can weather downturns and rally when the tide turns, and Jefferies has certainly shown it can do both. Granted, the ride has been bumpy. Over just the past week, the stock slipped by 6.3%, building on a softer trend from the last month, with a 1.7% dip and what has been a heavier 21.0% retreat since the start of the year. But if you pan out, the story changes. Over the past three years, Jefferies boasts a 125.5% gain. Looking back five years, shareholders have seen an astounding 274.6% increase. That’s more than enough to turn heads, despite this year’s pressure, which in part reflects changing risk perceptions across the financial sector as markets adjust to new macroeconomic realities.
Of course, recent price moves might have you wondering whether the growth is all spent or if the market has simply lost its nerve. To answer that, investors often turn to valuation metrics. On our checks, Jefferies scores a 2 out of 6 for undervaluation, hinting there are some pockets of value, though not across the board.
This section sets the stage for a deeper dive into the most common ways to value Jefferies. But stay with me, at the end I’ll share a smarter shortcut savvy investors use for an even clearer take on what this stock is really worth.
Jefferies Financial Group scores just 2/6 on our valuation checks. See what other red flags we found in the full valuation breakdown.
Approach 1: Jefferies Financial Group Excess Returns Analysis
The Excess Returns model evaluates how effectively a company generates returns above the cost of its equity capital. It focuses specifically on performance relative to shareholder investment. For Jefferies Financial Group, the approach examines key indicators, including its return on equity, cost of equity, and book value per share, to assess the company's ability to create value over time.
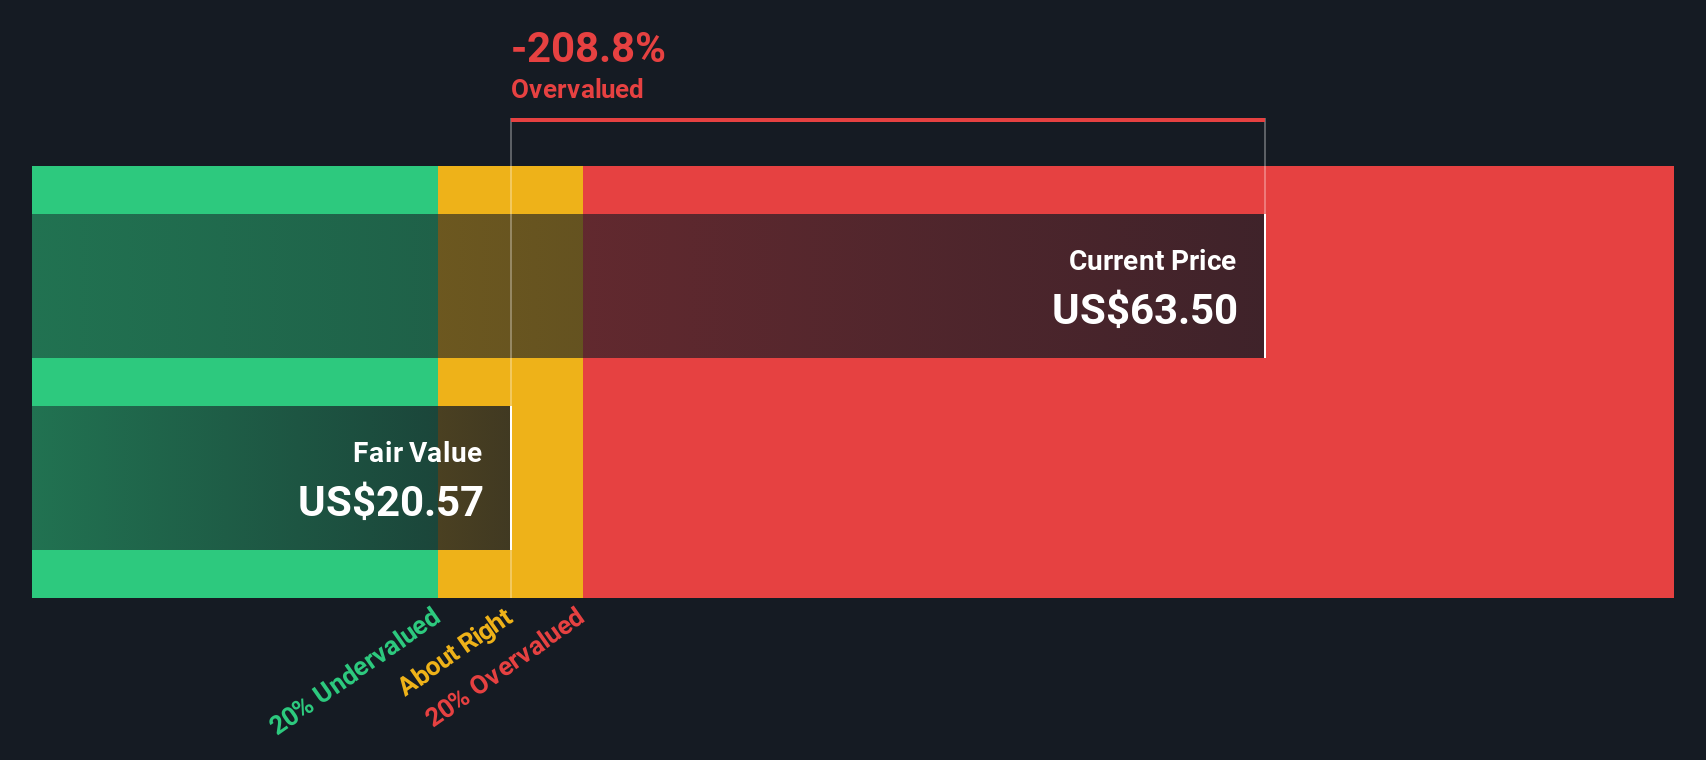
Currently, Jefferies reports a Book Value of $49.96 per share and a Stable Earnings Per Share (EPS) of $3.08, calculated from the median return on equity over the past five years. The Cost of Equity stands at $5.24 per share, while the average Return on Equity is 5.76%. The model also uses a Stable Book Value projection of $53.38 per share, which is based on weighted future estimates from two analysts. Critically, the Estimated Excess Return is -$2.16 per share, signaling that recent returns have lagged the company’s cost of equity.
Based on this analysis, the estimated intrinsic value per share falls considerably below the current market value. The intrinsic discount implied by the Excess Returns valuation suggests the stock is 193.6% overvalued, pointing to significant downside risk at present prices.
Result: OVERVALUED
Our Excess Returns analysis suggests Jefferies Financial Group may be overvalued by 193.6%. Find undervalued stocks or create your own screener to find better value opportunities.
Approach 2: Jefferies Financial Group Price vs Earnings
For a profitable company like Jefferies Financial Group, the price-to-earnings (PE) ratio is often a preferred metric for valuation. This multiple offers insight into how much investors are willing to pay for a dollar of the company’s earnings, providing a direct link between the market price and underlying profitability. Strong earnings growth typically justifies higher PE ratios. In contrast, more volatile earnings or higher perceived risks can result in a lower “fair” multiple.
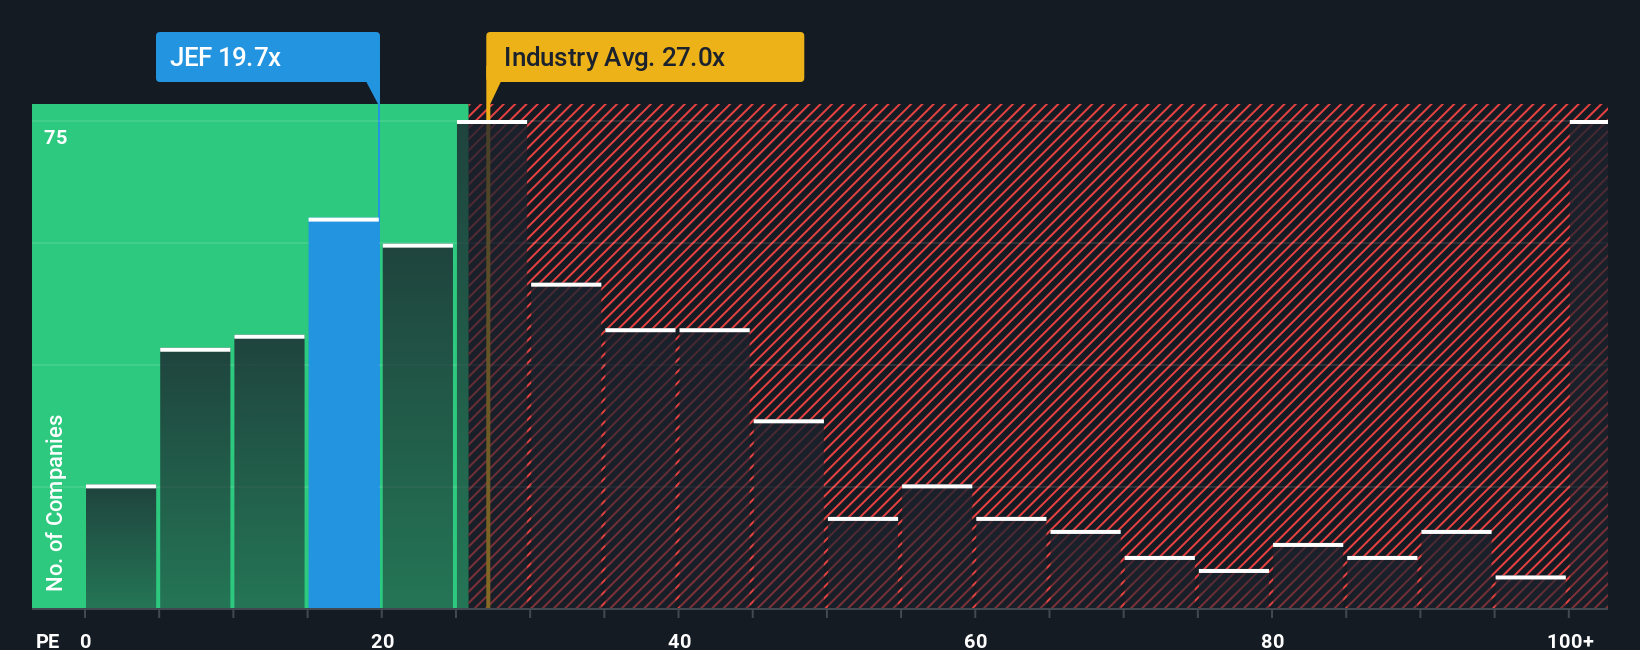
As of now, Jefferies trades at a PE ratio of 20.08x. For context, the average across its Capital Markets industry stands at 27.07x, while the peer group average is 22.98x. This suggests Jefferies is priced at a modest discount to both its industry and its closest competitors.
However, benchmarks alone do not tell the full story. Simply Wall St’s proprietary Fair Ratio, calculated at 18.23x for Jefferies, goes a step further by factoring in growth prospects, risk profile, profit margins, industry characteristics, and market cap. This holistic view more accurately reflects what a reasonable multiple should be for Jefferies at this time, offering a tailored benchmark rather than a one-size-fits-all comparison.
Comparing the current PE ratio of 20.08x to the Fair Ratio of 18.23x, Jefferies appears slightly overvalued based on this approach.
Result: OVERVALUED
PE ratios tell one story, but what if the real opportunity lies elsewhere? Discover companies where insiders are betting big on explosive growth.
Upgrade Your Decision Making: Choose your Jefferies Financial Group Narrative
Earlier we mentioned that there is an even better way to understand valuation, so let’s introduce you to Narratives. A Narrative is your personalized story about a company, built from your own assumptions on what its fair value is, how much future revenue or profit it could generate, and what margins might look like. Narratives link a company’s unique story to a financial forecast and, ultimately, to its fair value, helping you move beyond the numbers to what they actually mean for you as an investor.
Narratives are available directly on Simply Wall St’s platform in the Community page, used by millions of investors to share and compare perspectives. They offer an accessible way to bring your own insights to the table, making it easy to see whether a stock looks attractive based on your view, not just traditional metrics. You can then compare that fair value to the current price to decide if it is time to buy or sell, and Narratives update dynamically as new news or earnings come in.
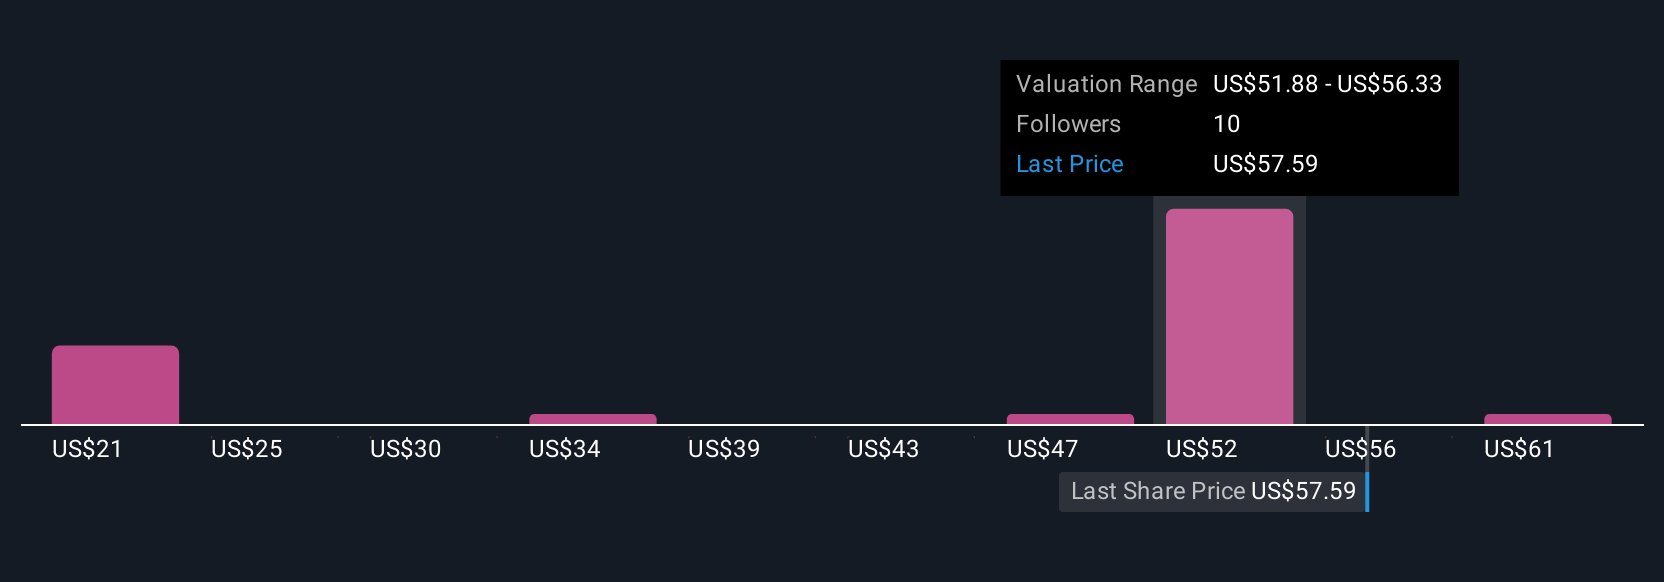
For Jefferies Financial Group, for example, one Narrative might see bright prospects and set a much higher fair value, while another might be cautious and project a lower estimate. This reflects different investor outlooks in real time.
Do you think there's more to the story for Jefferies Financial Group? Create your own Narrative to let the Community know!
This article by Simply Wall St is general in nature. We provide commentary based on historical data and analyst forecasts only using an unbiased methodology and our articles are not intended to be financial advice. It does not constitute a recommendation to buy or sell any stock, and does not take account of your objectives, or your financial situation. We aim to bring you long-term focused analysis driven by fundamental data. Note that our analysis may not factor in the latest price-sensitive company announcements or qualitative material. Simply Wall St has no position in any stocks mentioned.
New: Manage All Your Stock Portfolios in One Place
We've created the ultimate portfolio companion for stock investors, and it's free.
• Connect an unlimited number of Portfolios and see your total in one currency
• Be alerted to new Warning Signs or Risks via email or mobile
• Track the Fair Value of your stocks
Have feedback on this article? Concerned about the content? Get in touch with us directly. Alternatively, email editorial-team@simplywallst.com
About NYSE:JEF
Jefferies Financial Group
Operates as an investment banking and capital markets firm in the Americas, Europe, the Middle East, and the Asia-Pacific.
Proven track record average dividend payer.
Similar Companies
Market Insights

Advertisement
Community Narratives
The Next Phase of Energy Storage: How NeoVolta Is Tackling America’s Power Crunch
Fair Value US$7.50|35.1% undervalued
MA
Community Contributor
Why EnSilica is Worth Possibly 13x its Current Price
Fair Value UK£5.00|89.8% undervalued
DO
Community Contributor
M&A Activity, Industry Diversification & A Defense Contract Monopoly Will Push BWXT For Healthy Long-Term Growth
Fair Value US$220.00|15.2% undervalued
CL
Community Contributor
A case for Cassiar Gold Corp (TSXV: GLDC) to reach CAD$8-10 before 2030 (X30-37)
Fair Value CA$10.00|96.0% undervalued
AG
Community Contributor