Advertisement
- United States
- /
- Capital Markets
- /
- NYSE:JEF
Assessing Jefferies After 5% Weekly Rally and Fintech Investment Headlines

Simply Wall St
Reviewed by Bailey Pemberton
- Wondering if Jefferies Financial Group might be a hidden value play, or if recent moves have left it overpriced? You're not alone. Many investors are trying to make sense of where this stock stands today.
- The stock has climbed 5.3% in the past week and 8.8% over the past month, but remains down 27.2% year-to-date. This reflects significant volatility, which may indicate changing risk dynamics or a potential turnaround.
- Recent headlines have highlighted Jefferies’ strategic investments in new financial technology platforms, fueling speculation that leadership sees opportunity despite short-term volatility. Analysts have also noted sector-wide momentum as banks and financials attract renewed attention after months on the sidelines.
- When it comes to valuation, Jefferies scores a 2 out of 6 on our value checks, meaning it is considered undervalued in just two key areas. Next, we will explore how this number is calculated and point to an even more insightful way to assess value later in the article.
Jefferies Financial Group scores just 2/6 on our valuation checks. See what other red flags we found in the full valuation breakdown.
Approach 1: Jefferies Financial Group Excess Returns Analysis
The Excess Returns Model provides a nuanced look at how effectively a company uses shareholders' capital to generate returns above the basic cost of equity. For Jefferies Financial Group, this approach highlights the company's ability, or lack thereof, to deliver value beyond its investors' hurdle rate.
Looking at the latest data, Jefferies reports a Book Value of $50.60 per share and a Stable EPS (Earnings Per Share) of $3.07. These figures are derived from the median Return on Equity over the past five years, pointing to an Average Return on Equity of 5.76%. Jefferies' stable Book Value, reflecting future projections from two analysts, is estimated at $53.28 per share. Meanwhile, the calculated Cost of Equity stands at $5.22 per share.
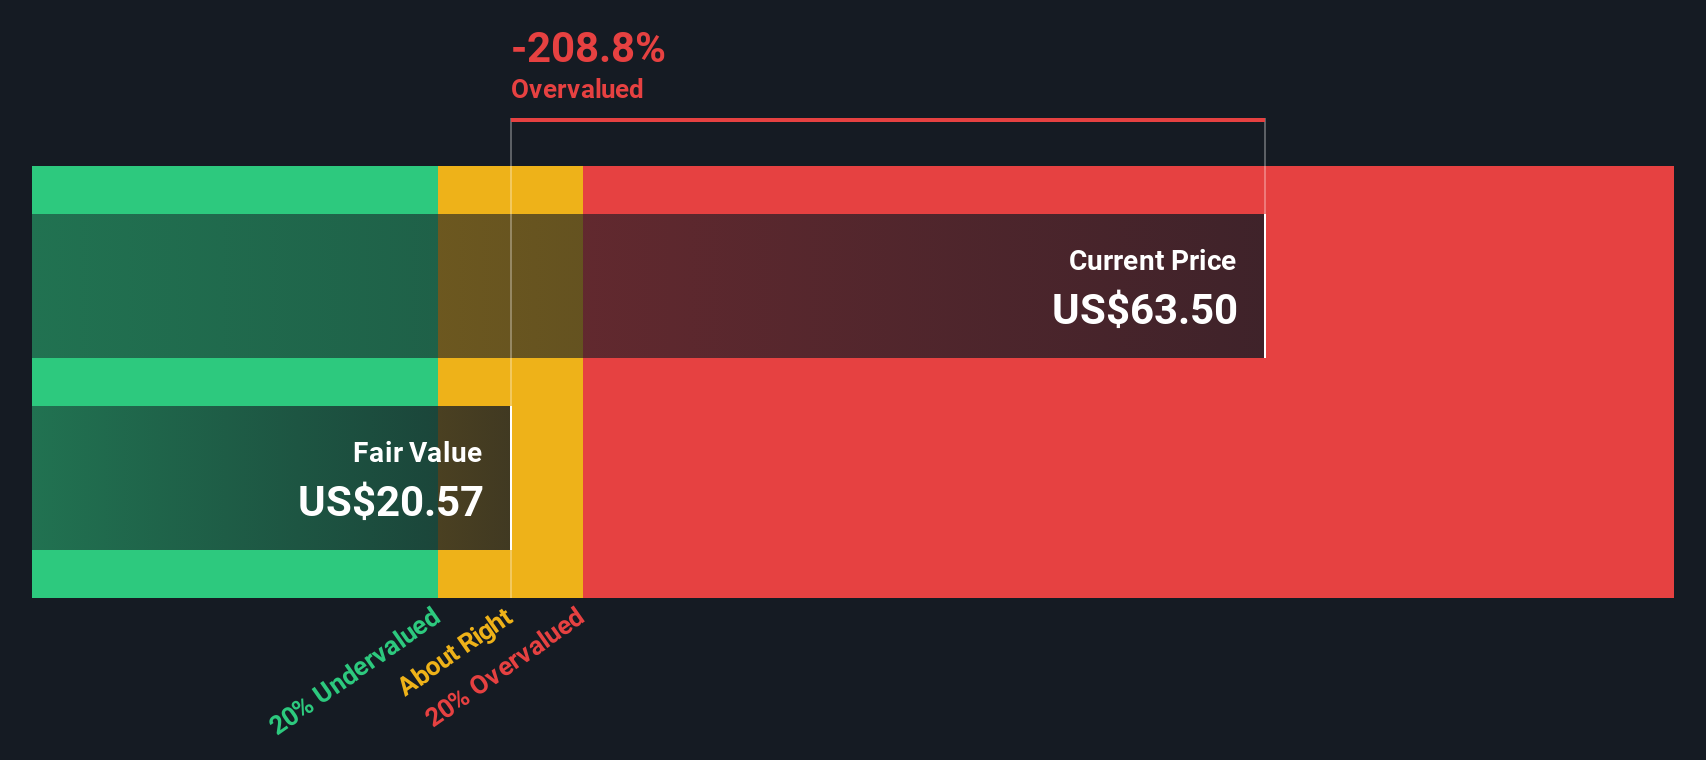
The key number here is the Excess Return, which comes in at $-2.15 per share. This means that after accounting for the cost of equity, Jefferies is generating negative excess returns. This suggests the company's returns are not sufficiently high to justify the capital invested by shareholders.
The model indicates that Jefferies Financial Group is currently trading at a substantial premium to its intrinsic value, with the Excess Returns valuation implying the stock is approximately 182.2% overvalued. This signals a clear disconnect between current market optimism and the underlying return metrics.
Result: OVERVALUED
Our Excess Returns analysis suggests Jefferies Financial Group may be overvalued by 182.2%. Discover 921 undervalued stocks or create your own screener to find better value opportunities.
Approach 2: Jefferies Financial Group Price vs Earnings
The Price-to-Earnings (PE) ratio is widely used for valuing profitable companies because it directly relates a company’s stock price to its per-share earnings, making it easy to compare companies of different sizes or across industries. It provides a snapshot of how much investors are willing to pay today for a dollar of future earnings, which is particularly relevant for companies with steady or predictable profitability.
Growth expectations and risk have a significant influence on what constitutes a "normal" or "fair" PE ratio. Fast-growing, stable companies often trade at higher PE ratios, as investors anticipate greater future profits. Companies in slower-growth or riskier industries generally command lower multiples. Fundamentally, a fair PE should reflect reasonable earnings growth, market conditions, and the relative stability of the business.
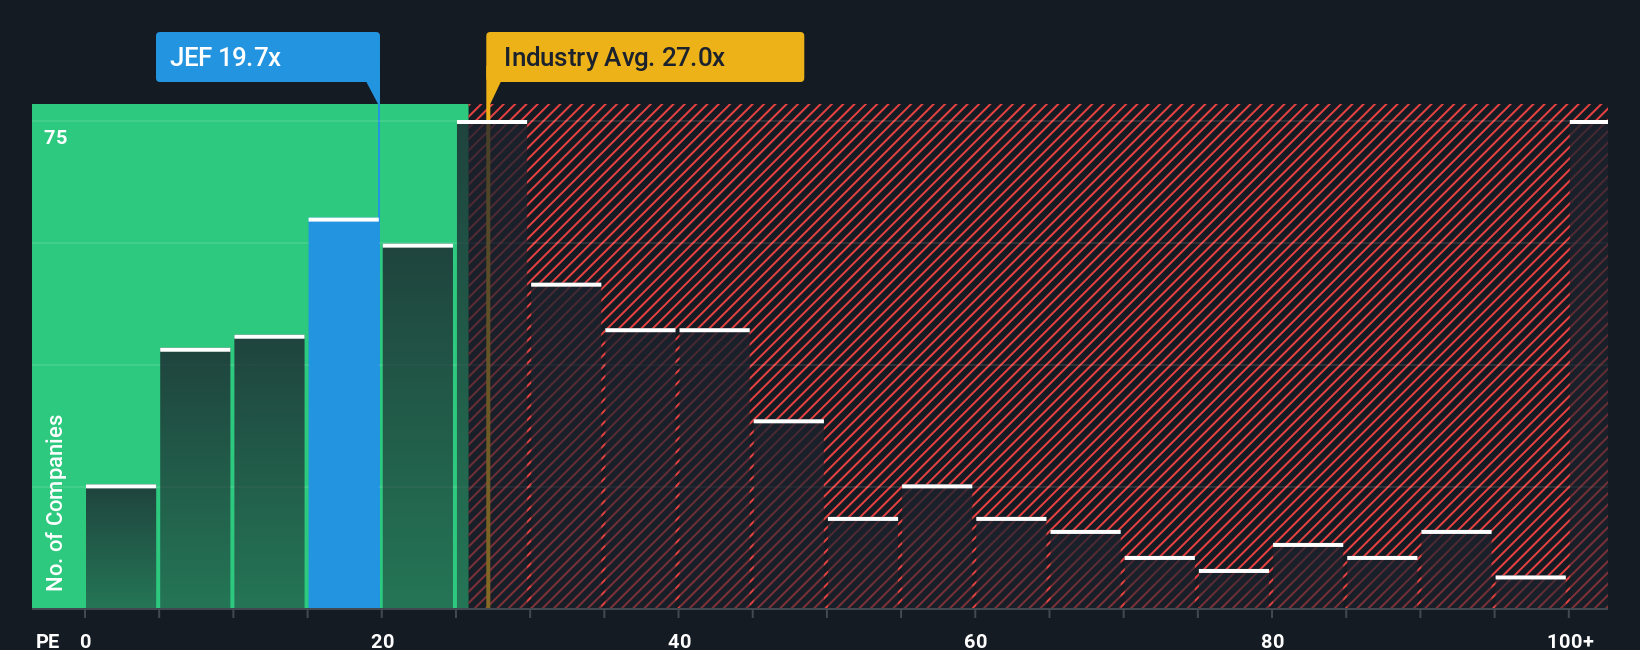
Currently, Jefferies Financial Group trades on a PE ratio of 18.5x. This is below the industry average of 23.9x and also below the peer average of 20.7x among Capital Markets companies. Simply Wall St’s proprietary “Fair Ratio,” which adjusts for the company’s unique blend of earnings growth, industry, margins, market cap, and risk profile, is 17.8x for Jefferies. This approach is considered more insightful than traditional peer or industry comparisons because it tailors the valuation to Jefferies’ individual context, taking into account fundamental drivers instead of relying on broad averages.
Comparing the Fair Ratio of 17.8x to Jefferies’ current PE of 18.5x, the difference is modest. This suggests the stock price is in line with its fundamentals at the moment.
Result: ABOUT RIGHT
PE ratios tell one story, but what if the real opportunity lies elsewhere? Discover 1438 companies where insiders are betting big on explosive growth.
Upgrade Your Decision Making: Choose your Jefferies Financial Group Narrative
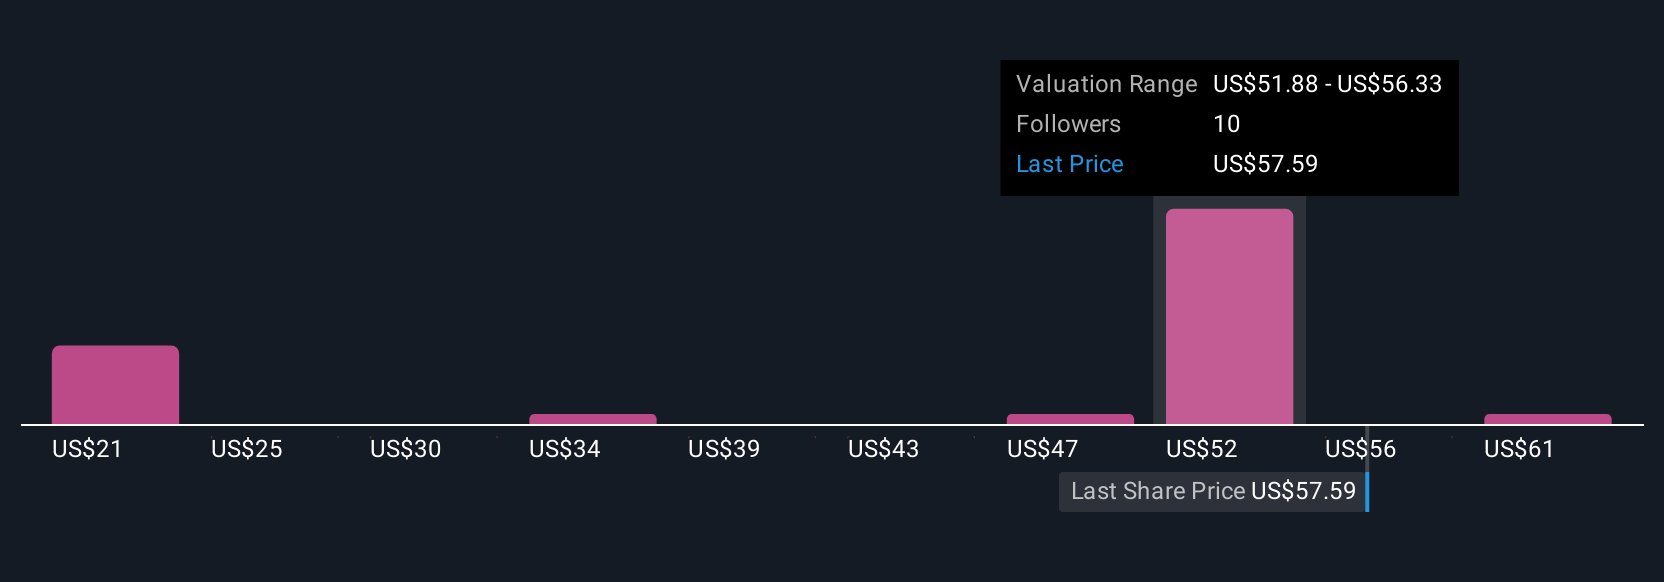
Earlier we mentioned that there is an even better way to understand valuation, so let's introduce you to Narratives. A Narrative is simply your story behind the numbers. You link your views about a company's prospects, like future revenue or earnings, to a forecast and then a fair value. This approach bridges your perspective with hard data, creating a financial forecast that is transparent and easy to revisit. Narratives take the guesswork out of investing by allowing you to compare your personal Fair Value to the company’s current Price, helping you decide whether it’s time to buy or sell.
Accessible right on Simply Wall St’s Community page and used by millions of investors, Narratives are a straightforward and powerful tool that update dynamically whenever new information, like news or earnings reports, is available. For example, with Jefferies Financial Group, some investors may see significant upside potential while others, using the same data, may forecast a much lower fair value based on a more cautious earnings outlook. By crafting your own Narrative, you make smarter, more informed investment choices tailored to your viewpoint, all in one place.
Do you think there's more to the story for Jefferies Financial Group? Head over to our Community to see what others are saying!
This article by Simply Wall St is general in nature. We provide commentary based on historical data and analyst forecasts only using an unbiased methodology and our articles are not intended to be financial advice. It does not constitute a recommendation to buy or sell any stock, and does not take account of your objectives, or your financial situation. We aim to bring you long-term focused analysis driven by fundamental data. Note that our analysis may not factor in the latest price-sensitive company announcements or qualitative material. Simply Wall St has no position in any stocks mentioned.
New: Manage All Your Stock Portfolios in One Place
We've created the ultimate portfolio companion for stock investors, and it's free.
• Connect an unlimited number of Portfolios and see your total in one currency
• Be alerted to new Warning Signs or Risks via email or mobile
• Track the Fair Value of your stocks
Have feedback on this article? Concerned about the content? Get in touch with us directly. Alternatively, email editorial-team@simplywallst.com
About NYSE:JEF
Jefferies Financial Group
Operates as an investment banking and capital markets firm in the Americas, Europe, the Middle East, and the Asia-Pacific.
Proven track record average dividend payer.
Similar Companies
Market Insights

Advertisement
Community Narratives
MicroVision will explode future revenue by 380.37% with a vision towards success
Fair Value US$60|98.4% undervalued
TH
Community Contributor
The Indispensable Artery for a New North American Economy
Fair Value CA$132.87|0.7% overvalued
TI
Community Contributor
Recently Updated Narratives
CO

composite32 on Astor Enerji ·
Astor Enerji will surge with a fair value of $140.43 in the next 3 years
Fair Value:₺140.4335.5% undervalued
1 followerusers have followed this narrative
0 commentsusers have commented on this narrative
0 likesusers have liked this narrative
RE

RecMag on Proximus ·
Proximus: The State-Backed Backup Plan with 7% Gross Yield and 15% Currency Upside.
Fair Value:€17.1356.7% undervalued
30 followersusers have followed this narrative
0 commentsusers have commented on this narrative
0 likesusers have liked this narrative
AG


Agricola on IMPACT Silver ·
A case for for IMPACT Silver Corp (TSXV:IPT) to reach USD $4.52 (CAD $6.16) in 2026 (23 bagger in 1 year) and USD $5.76 (CAD $7.89) by 2030
Fair Value:CA$7.8996.2% undervalued
1 followerusers have followed this narrative
0 commentsusers have commented on this narrative
0 likesusers have liked this narrative
Popular Narratives
TH

TheWallstreetKing on MicroVision ·
MicroVision will explode future revenue by 380.37% with a vision towards success
Fair Value:US$6098.4% undervalued
101 followersusers have followed this narrative
10 commentsusers have commented on this narrative
20 likesusers have liked this narrative
OS


oscargarcia on Alphabet ·
The company that turned a verb into a global necessity and basically runs the modern internet, digital ads, smartphones, maps, and AI.
Fair Value:US$3405.8% undervalued
139 followersusers have followed this narrative
6 commentsusers have commented on this narrative
18 likesusers have liked this narrative
AN


AnalystConsensusTarget on NVIDIA ·
NVDA: Expanding AI Demand Will Drive Major Data Center Investments Through 2026
Fair Value:US$250.3929.3% undervalued
931 followersusers have followed this narrative
6 commentsusers have commented on this narrative
23 likesusers have liked this narrative