Advertisement
- United States
- /
- Diversified Financial
- /
- NYSE:BRK.A
Assessing Berkshire Hathaway’s Value After Recent Insurance Moves and Five-Year 139% Surge

Simply Wall St
Reviewed by Bailey Pemberton
Thinking about what to do with your Berkshire Hathaway shares, or whether now is the time to get in? You are definitely not alone. The stock is always on the radar for long-term investors, headline hounds, and value hunters alike. Even after its stunning run over the last five years—up 138.5%, no less—Berkshire’s latest price movements have captured plenty of attention. Over the last year, the stock has returned 6.9%, with a 9.6% gain so far in 2024. The past week was a bit softer, down 0.4%, and over the past month it has been essentially flat. But if you zoom out, the three-year return of 69.7% shows Berkshire’s resilience, even through market uncertainty and shifting investor sentiment.
Recent headlines around Berkshire’s moves in the insurance sector and its high-profile portfolio tweaks have played a role in shaping how the market views both its risks and its growth potential. Investors often interpret these signals as subtle shifts in Warren Buffett’s famous approach or as cues for where the “smart money” might be heading next. With so many eyes on Berkshire, how it is valued becomes even more interesting. On a classic valuation score, it checks the box for being undervalued in 4 out of 6 categories, which is notable for a company of this size and pedigree.
That brings us to the heart of the matter: what do these valuation signals really tell us, and is there a smarter way to assess whether Berkshire is a buy right now? In the next section, we will dig into the valuation approaches behind that score, then explore a perspective even more telling than the numbers alone.
Approach 1: Berkshire Hathaway Excess Returns Analysis
The Excess Returns valuation model measures how efficiently a company turns its invested capital into profits above its cost of capital. It is a useful framework for industries where companies generate sustainable returns higher than the cost of equity, something Berkshire Hathaway is well known for.
For Berkshire Hathaway, the numbers stand out: the average Return on Equity over the past five years is 13.00%, and its current Book Value sits at $464,307.83 per share. With a Stable EPS of $64,311.36 per share, calculated from the median Return on Equity, and an estimated Cost of Equity at $37,683.92 per share, Berkshire is delivering an annual Excess Return of $26,627.44 per share. Looking ahead, analysts estimate a Stable Book Value of $494,556.79 per share, reflecting expectations of continued disciplined reinvestment and profit generation.
Based on these inputs, the Excess Returns model points to an intrinsic value approximately 31.5% higher than the current share price. This makes Berkshire appear significantly undervalued relative to its long-term potential and steady profit engine.
Result: UNDERVALUED
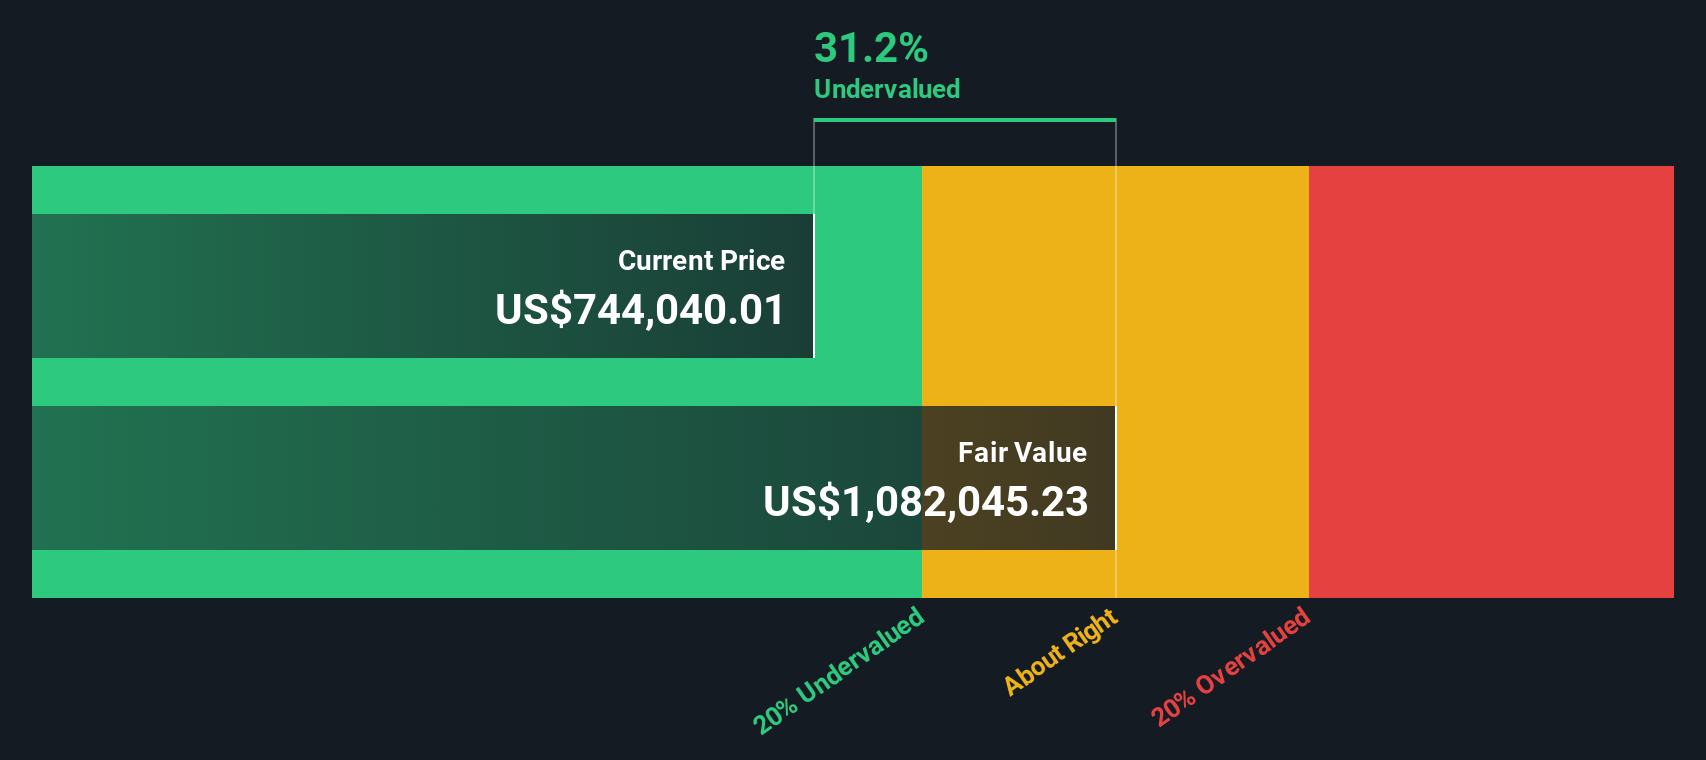
Our Excess Returns analysis suggests Berkshire Hathaway is undervalued by 31.5%. Track this in your watchlist or portfolio, or discover more undervalued stocks.
Approach 2: Berkshire Hathaway Price vs Earnings
The Price-to-Earnings (PE) ratio is one of the most widely used valuation tools for profitable companies like Berkshire Hathaway, as it offers a direct sense of how much investors are paying for each dollar of earnings. PE ratios are especially relevant here because Berkshire consistently generates significant profits, making this metric both intuitive and meaningful.
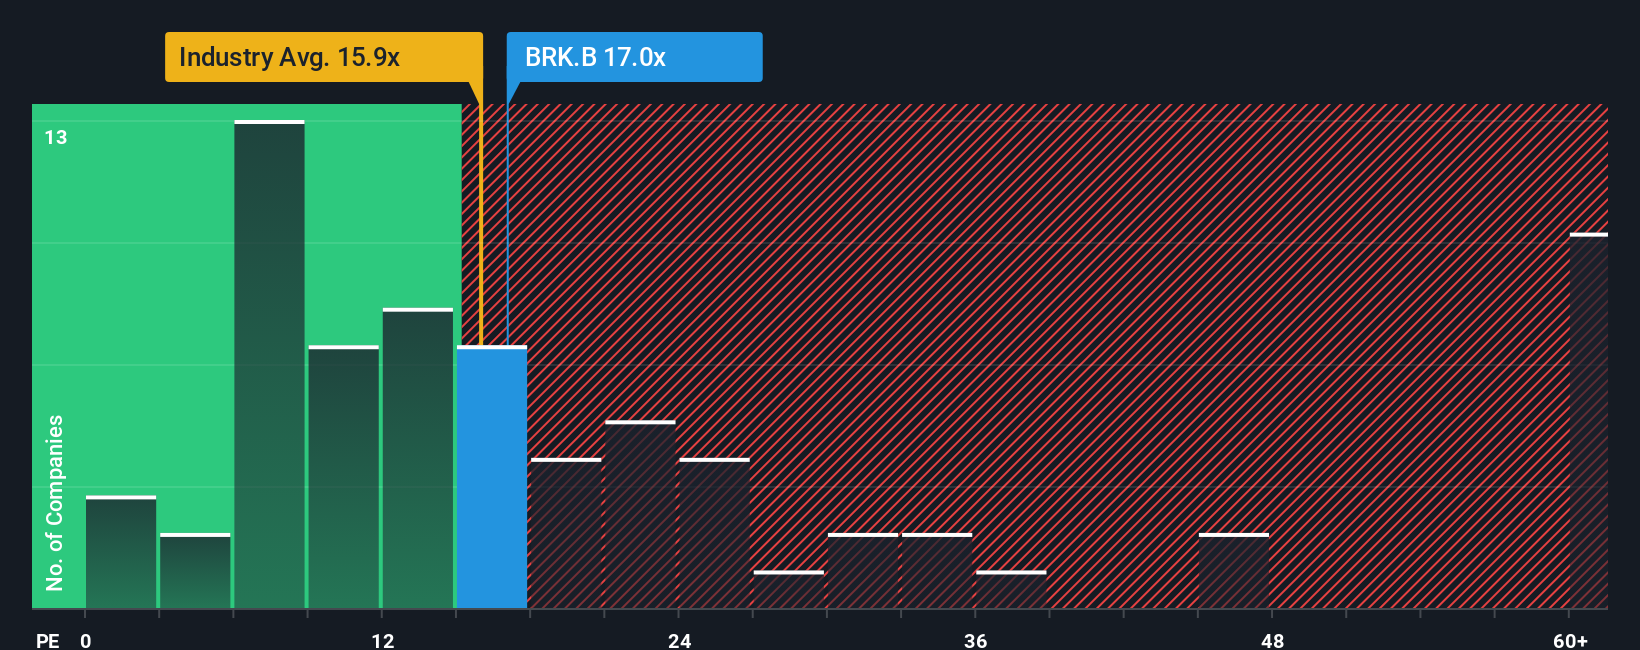
Interpreting a "normal" or "fair" PE for any company depends on growth prospects and the risks involved. Companies with faster earnings growth or lower risk typically command higher PE multiples, while those with more uncertain outlooks may trade at a discount. Berkshire’s current PE is 16.9x. This sits just above the Diversified Financial industry average of 16.5x, but notably below the average PE of its closest peers at 25.7x.
To move beyond basic comparisons, Simply Wall St uses a proprietary "Fair Ratio" that weighs more than just peer multiples. It incorporates factors like earnings growth, profit margins, market cap, and unique sector risk to arrive at a nuanced and company-specific benchmark. For Berkshire, the Fair Ratio stands at 19.8x. This suggests a multiple more in line with its quality and steady earnings power than the broader industry average would indicate. Because the current PE of 16.9x is lower than this Fair Ratio, the analysis points to Berkshire Hathaway being undervalued at these levels.
Result: UNDERVALUED
PE ratios tell one story, but what if the real opportunity lies elsewhere? Discover companies where insiders are betting big on explosive growth.
Upgrade Your Decision Making: Choose your Berkshire Hathaway Narrative
Earlier we mentioned there is a better way to understand valuation, so let's introduce you to Narratives, a smarter, story-driven approach that connects the numbers to real-life investor perspectives.
A Narrative is simply your take on a company's future, linking what you believe about Berkshire Hathaway's business, leadership, and prospects to forecasts for things like revenue, profit margins, or fair value.
On Simply Wall St's Community page, millions of investors use Narratives to share, compare, and learn from diverse views. This makes it easy and accessible for you to see how other investors are thinking and adjust your own assumptions dynamically as news or earnings are released.
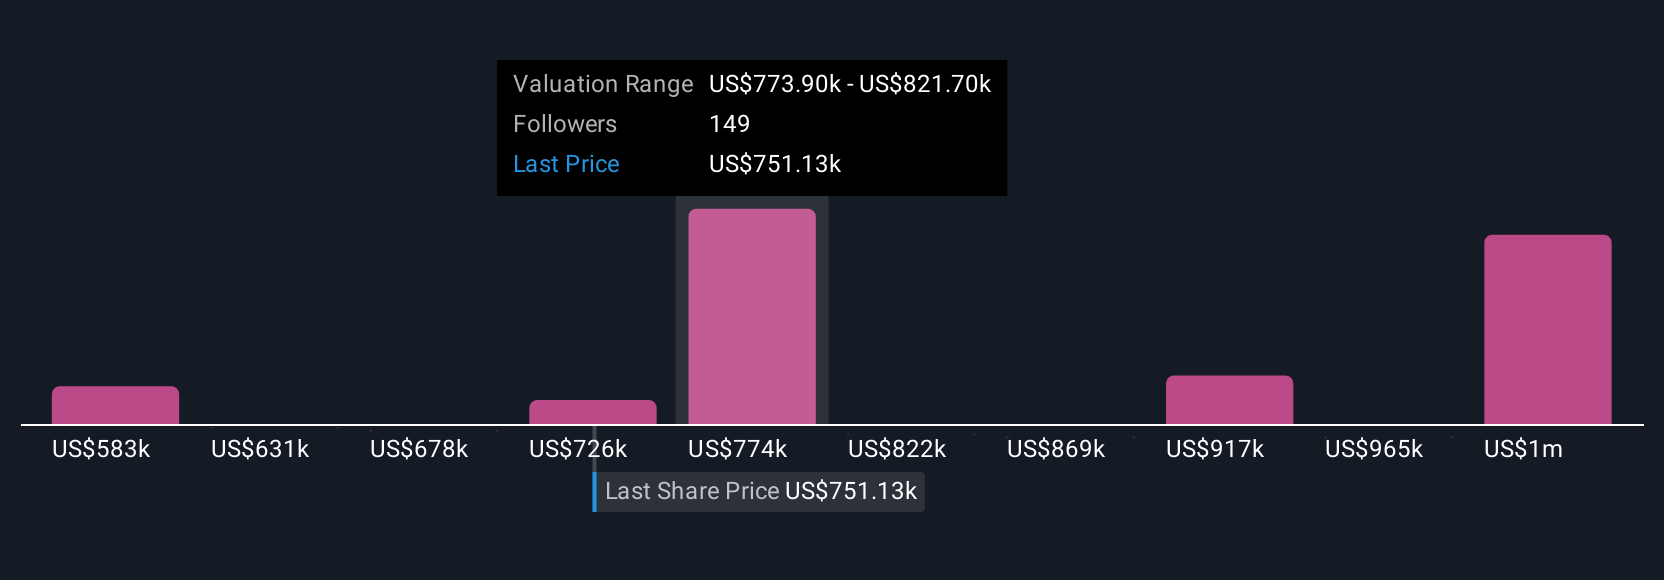
Narratives help you decide when to buy or sell by visually comparing someone’s estimate of Berkshire’s fair value to the current share price. This process is continually updated as new data emerges.
For example, some investors see Berkshire’s share value at around $605,000 based on steady returns and defensive positioning, while others believe it could be worth closer to $944,000 factoring in stronger growth and higher margins. These contrasting Narratives give you a powerful, dynamic perspective to inform your own decisions.
For Berkshire Hathaway, however, we will make it really easy for you with previews of two leading Berkshire Hathaway Narratives:
🐂 Berkshire Hathaway Bull Case
Fair Value: $943,786
Undervalued by: 21.5%
Expected Revenue Growth: 13%
- Highlights Berkshire’s robust balance sheet, low debt-to-equity, and significant cash reserves as strengths for long-term growth and stability.
- Emphasizes the disciplined, value-driven investment approach and confidence in succession under Greg Abel, ensuring stability after Buffett.
- Projects 12 to 15 percent net inflation-adjusted share price growth over the next few years, driven by proven fundamentals and prudent leadership transition.
🐻 Berkshire Hathaway Bear Case
Fair Value: $604,196
Overvalued by: 22.6%
Expected Revenue Growth: 3.6%
- Notes Berkshire’s cautious shift towards cash and liquid assets, viewing the portfolio as positioned defensively for uncertain economic climates.
- Points out the company’s diversified but mature business mix, limiting high growth, and highlights potential succession and management risks post-Buffett.
- Forecasts modest revenue growth and indicates that share price is above the narrative's fair value, cautioning that future performance may be less robust without Buffett’s direct leadership.
Do you think there's more to the story for Berkshire Hathaway? Create your own Narrative to let the Community know!
This article by Simply Wall St is general in nature. We provide commentary based on historical data and analyst forecasts only using an unbiased methodology and our articles are not intended to be financial advice. It does not constitute a recommendation to buy or sell any stock, and does not take account of your objectives, or your financial situation. We aim to bring you long-term focused analysis driven by fundamental data. Note that our analysis may not factor in the latest price-sensitive company announcements or qualitative material. Simply Wall St has no position in any stocks mentioned.
Valuation is complex, but we're here to simplify it.
Discover if Berkshire Hathaway might be undervalued or overvalued with our detailed analysis, featuring fair value estimates, potential risks, dividends, insider trades, and its financial condition.
Access Free AnalysisHave feedback on this article? Concerned about the content? Get in touch with us directly. Alternatively, email editorial-team@simplywallst.com
About NYSE:BRK.A
Berkshire Hathaway
Through its subsidiaries, engages in the insurance, freight rail transportation, and utility businesses.
Flawless balance sheet and good value.
Similar Companies
Market Insights

Advertisement
Community Narratives
Finding The True Value Of A Logistics Powerhouse
Fair Value US$95.21|8.7% undervalued
NV
Community Contributor
Paradigm Biopharmaceuticals Will Lead Osteoarthritis Treatment with Zilosul's FDA Success
Fair Value AU$5.50|93.3% undervalued
AM
Community Contributor
Barrick Mining (ABX:CA): A Gold Hedge against a U.S. Shutdown
Fair Value CA$60.00|18.7% undervalued
GM
Community Contributor