Advertisement
- United States
- /
- Capital Markets
- /
- NYSE:BLK
Should You Revisit BlackRock After Its Record $10 Trillion Assets Milestone in 2025?

Simply Wall St
Reviewed by Bailey Pemberton
Thinking about what to do with BlackRock stock? You are definitely not alone. Whether you already own shares or are sizing up an entry point, it is hard to ignore how this asset management giant keeps breaking its own records. In just the last year, BlackRock has surged 24.4%. The momentum has continued across almost every time frame, with a remarkable 136.3% jump over three years and a 105.3% gain since 2019. Even over the past month alone, it climbed 5.4%, easily outpacing broader markets.
Much of this consistent growth can be traced to a general market shift toward passive investing and ETFs, arenas where BlackRock has secured enormous influence. Recent trends in financial markets have also worked in its favor, drawing more global money flows under its management and boosting investor optimism, as reflected in the steadily rising stock price.
Still, a run-up like this always invites questions about what is actually “priced in” and whether the stock’s valuation is justified by its long-term prospects. According to our current scorecard, BlackRock is undervalued in just 1 out of 6 key checks. This does not exactly make it a bargain by some traditional measures.
But valuation is never one-dimensional. Next, we will break down the methods often used to assess whether a company like BlackRock is truly undervalued, fairly priced, or expensive. Stay tuned, because by the end of the article, we will look at a better way to tie it all together for your investing decision.
BlackRock scores just 1/6 on our valuation checks. See what other red flags we found in the full valuation breakdown.
Approach 1: BlackRock Excess Returns Analysis
The Excess Returns model evaluates a company by measuring how much profit it can generate above the required rate of return expected by investors. Instead of just looking at projected cash flows or dividends, it focuses on the returns BlackRock earns on its invested capital, compared to its cost of equity. This approach is particularly telling for a financial powerhouse operating with significant capital at stake.
For BlackRock, the key numbers reveal the continuing strength of its business model. The latest book value is $317.55 per share, while its “stable” earnings per share are projected at $52.12, based on a weighted consensus from five analyst forecasts. The cost of equity sits at $26.59 per share, giving an excess return of $25.53 per share. BlackRock’s average return on equity is an impressive 16.25 percent, with future book value estimates anchoring at $320.65 per share.
Together, these returns indicate that BlackRock is consistently generating gains well above what it costs to fund its equity. However, according to the Excess Returns model, the intrinsic value is about $810.40 per share. With current market pricing implying that the stock is approximately 43.8 percent overvalued, caution is warranted for new investors.
Result: OVERVALUED
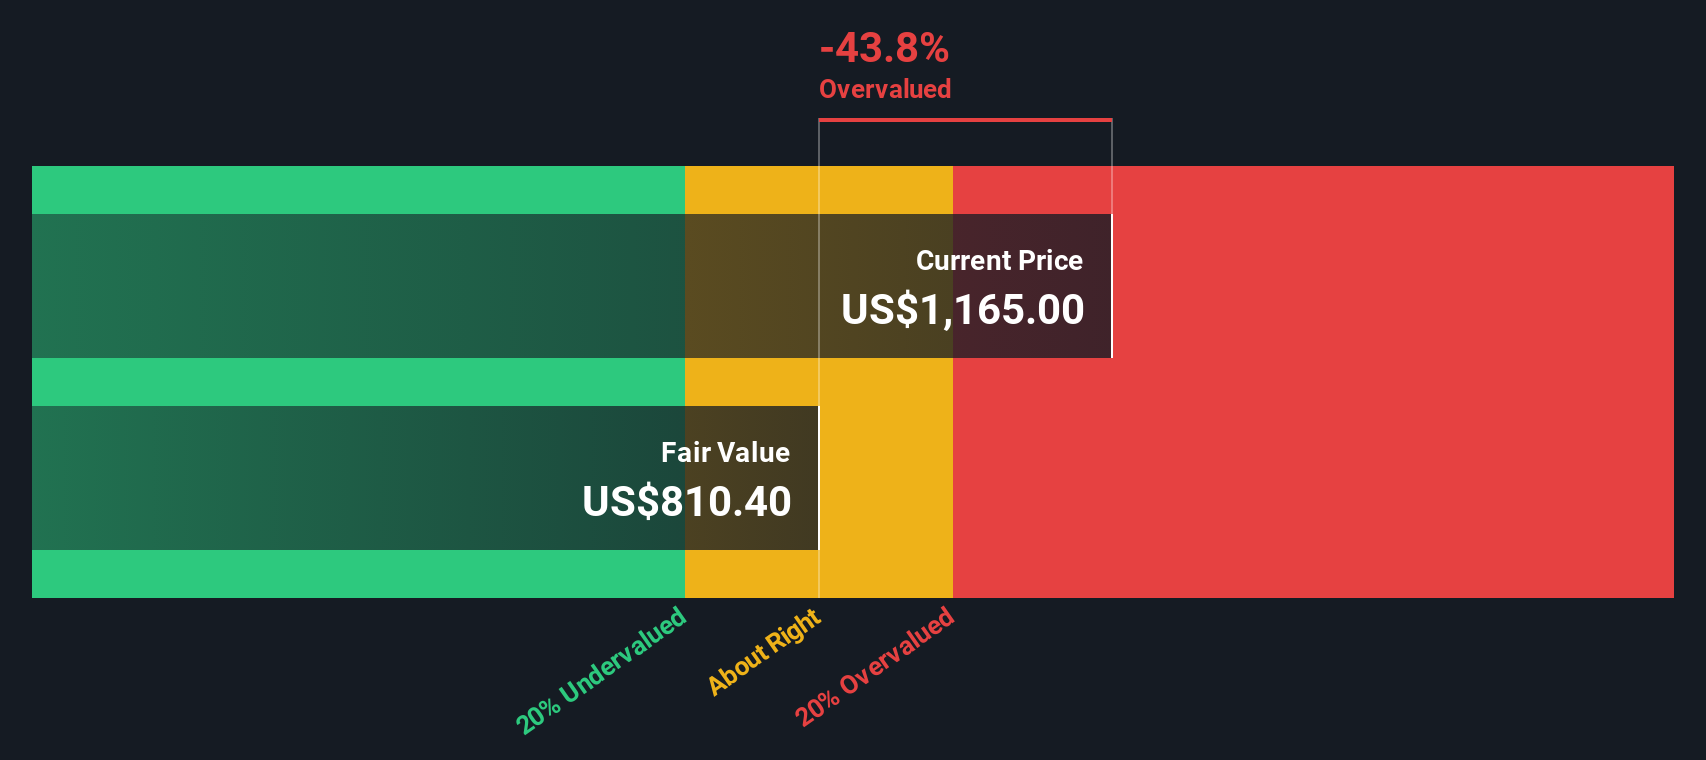
Our Excess Returns analysis suggests BlackRock may be overvalued by 43.8%. Find undervalued stocks or create your own screener to find better value opportunities.
Approach 2: BlackRock Price vs Earnings
Price-to-Earnings (PE) is often the go-to metric when valuing well-established, profitable companies like BlackRock. The reason is simple: it directly measures what investors are willing to pay for each dollar of current earnings. For a company generating steady profits, PE gives a clear sense of how optimism, growth expectations and risk are being factored into the stock price.
It is important to remember that higher growth rates or perceived stability usually justify a higher “normal” or “fair” PE ratio, while higher risk or slowing growth results in a lower fair multiple. At the moment, BlackRock’s PE ratio stands at 28.2x. That is a premium to the Capital Markets industry average of 25.7x, though well below its peer average of 51.1x. On its own, these comparisons might suggest the stock is a little pricey but not wildly out of line.
This is where Simply Wall St’s Fair Ratio comes in. Their proprietary Fair Ratio for BlackRock is 20.9x. This ratio synthesizes factors like growth forecasts, profit margins, industry context, and company size, delivering a more customized assessment than a one-size-fits-all peer or industry average. Because this model accounts for BlackRock’s specific risks and growth profile, it tends to offer a more balanced picture for long-term investors.
Comparing the 28.2x actual PE to the 20.9x Fair Ratio points to an overvalued stock by this measure, with the current valuation notably above what would be expected given BlackRock’s unique profile.
Result: OVERVALUED

PE ratios tell one story, but what if the real opportunity lies elsewhere? Discover companies where insiders are betting big on explosive growth.
Upgrade Your Decision Making: Choose your BlackRock Narrative
Earlier we mentioned there is an even better way to understand valuation. Let us introduce you to Narratives, a dynamic approach that empowers you to link BlackRock’s story with your own outlook for its future, then convert that view directly into a fair value and decision point.
A Narrative is simply your answer to, “What do you believe about BlackRock’s future?” You build a story, your perspective on the company’s growth, business strengths, and risks, which is instantly translated into numbers such as targeted revenue growth, profit margins, and a fair value estimate for the shares.
Unlike static valuation models or analyst targets, Narratives invite you to be the forecaster, letting your investment thesis drive each number, rather than relying solely on historical data or consensus opinions.
This innovative feature is available to millions of investors via Simply Wall St’s Community page, where Narratives can be created, shared, or compared with others to see how views change when new results or news hit the market.
Narratives are always up to date, refreshing in real time when quarterly earnings or big headlines arrive. Your fair value and conviction about buying or selling can adjust right alongside the facts.
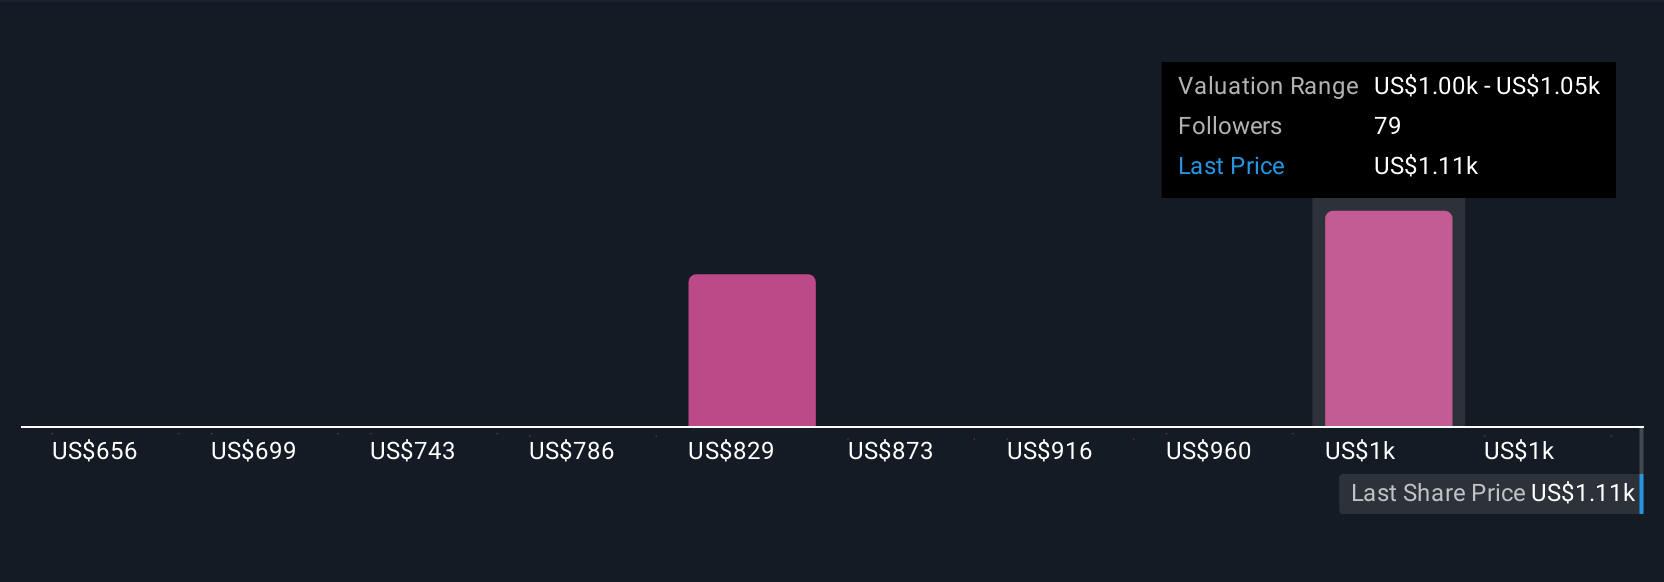
For example, one investor might build a bullish BlackRock Narrative using the Community high price target of $1,252, focused on rapid expansion into private markets and tech, while a more cautious peer might anchor to the $1,000 low target, emphasizing risks like margin pressure and regulatory challenges. This places your goals and judgments at the center of every decision.
Do you think there's more to the story for BlackRock? Create your own Narrative to let the Community know!
This article by Simply Wall St is general in nature. We provide commentary based on historical data and analyst forecasts only using an unbiased methodology and our articles are not intended to be financial advice. It does not constitute a recommendation to buy or sell any stock, and does not take account of your objectives, or your financial situation. We aim to bring you long-term focused analysis driven by fundamental data. Note that our analysis may not factor in the latest price-sensitive company announcements or qualitative material. Simply Wall St has no position in any stocks mentioned.
Valuation is complex, but we're here to simplify it.
Discover if BlackRock might be undervalued or overvalued with our detailed analysis, featuring fair value estimates, potential risks, dividends, insider trades, and its financial condition.
Access Free AnalysisHave feedback on this article? Concerned about the content? Get in touch with us directly. Alternatively, email editorial-team@simplywallst.com
About NYSE:BLK
Established dividend payer with adequate balance sheet.
Similar Companies
Market Insights

Advertisement
Community Narratives
A formidable player in AI and enterprise computing.
Fair Value US$210.00|12.2% overvalued
CO
Community Contributor
IREN's Bold Moves in Sustainable Bitcoin Mining & AI Data Centers
Fair Value US$72.52|17.1% undervalued
BL
Community Contributor
Cooling the Champions: The Aussie Tech Behind F1's Victories
Fair Value AU$12.40|38.7% undervalued
TR
Community Contributor