- United States
- /
- Capital Markets
- /
- NYSE:AMP
Those who invested in Ameriprise Financial (NYSE:AMP) three years ago are up 237%


Ameriprise Financial, Inc. (NYSE:AMP) shareholders might be concerned after seeing the share price drop 12% in the last month. But in three years the returns have been great. Indeed, the share price is up a very strong 217% in that time. It's not uncommon to see a share price retrace a bit, after a big gain. The thing to consider is whether the underlying business is doing well enough to support the current price.
Let's take a look at the underlying fundamentals over the longer term, and see if they've been consistent with shareholders returns.
Check out our latest analysis for Ameriprise Financial
To quote Buffett, 'Ships will sail around the world but the Flat Earth Society will flourish. There will continue to be wide discrepancies between price and value in the marketplace...' One imperfect but simple way to consider how the market perception of a company has shifted is to compare the change in the earnings per share (EPS) with the share price movement.
During three years of share price growth, Ameriprise Financial achieved compound earnings per share growth of 20% per year. This EPS growth is lower than the 47% average annual increase in the share price. So it's fair to assume the market has a higher opinion of the business than it did three years ago. That's not necessarily surprising considering the three-year track record of earnings growth.
The image below shows how EPS has tracked over time (if you click on the image you can see greater detail).
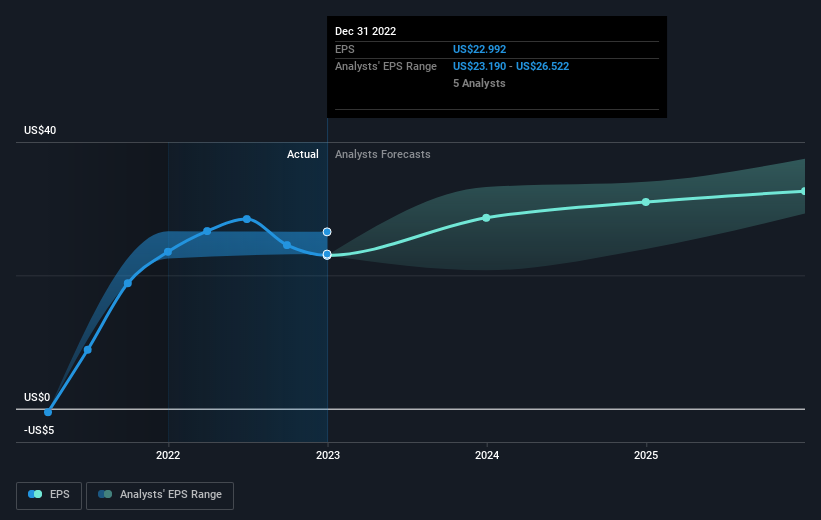
Dive deeper into Ameriprise Financial's key metrics by checking this interactive graph of Ameriprise Financial's earnings, revenue and cash flow.
What About Dividends?
It is important to consider the total shareholder return, as well as the share price return, for any given stock. The TSR is a return calculation that accounts for the value of cash dividends (assuming that any dividend received was reinvested) and the calculated value of any discounted capital raisings and spin-offs. Arguably, the TSR gives a more comprehensive picture of the return generated by a stock. We note that for Ameriprise Financial the TSR over the last 3 years was 237%, which is better than the share price return mentioned above. This is largely a result of its dividend payments!
A Different Perspective
Although it hurts that Ameriprise Financial returned a loss of 2.0% in the last twelve months, the broader market was actually worse, returning a loss of 15%. Longer term investors wouldn't be so upset, since they would have made 18%, each year, over five years. In the best case scenario the last year is just a temporary blip on the journey to a brighter future. I find it very interesting to look at share price over the long term as a proxy for business performance. But to truly gain insight, we need to consider other information, too. To that end, you should be aware of the 1 warning sign we've spotted with Ameriprise Financial .
For those who like to find winning investments this free list of growing companies with recent insider purchasing, could be just the ticket.
Please note, the market returns quoted in this article reflect the market weighted average returns of stocks that currently trade on American exchanges.
If you're looking to trade Ameriprise Financial, open an account with the lowest-cost platform trusted by professionals, Interactive Brokers.
With clients in over 200 countries and territories, and access to 160 markets, IBKR lets you trade stocks, options, futures, forex, bonds and funds from a single integrated account.
Enjoy no hidden fees, no account minimums, and FX conversion rates as low as 0.03%, far better than what most brokers offer.
Sponsored ContentNew: Manage All Your Stock Portfolios in One Place
We've created the ultimate portfolio companion for stock investors, and it's free.
• Connect an unlimited number of Portfolios and see your total in one currency
• Be alerted to new Warning Signs or Risks via email or mobile
• Track the Fair Value of your stocks
Have feedback on this article? Concerned about the content? Get in touch with us directly. Alternatively, email editorial-team (at) simplywallst.com.
This article by Simply Wall St is general in nature. We provide commentary based on historical data and analyst forecasts only using an unbiased methodology and our articles are not intended to be financial advice. It does not constitute a recommendation to buy or sell any stock, and does not take account of your objectives, or your financial situation. We aim to bring you long-term focused analysis driven by fundamental data. Note that our analysis may not factor in the latest price-sensitive company announcements or qualitative material. Simply Wall St has no position in any stocks mentioned.
About NYSE:AMP
Ameriprise Financial
Operates as a diversified financial services company in the United States and internationally.
Good value with adequate balance sheet and pays a dividend.
Similar Companies
Market Insights

Community Narratives

