- United States
- /
- Capital Markets
- /
- NasdaqGS:TROW
T. Rowe Price Group's (NASDAQ:TROW) earnings trajectory could turn positive as the stock lifts 3.1% this past week


For many investors, the main point of stock picking is to generate higher returns than the overall market. But in any portfolio, there are likely to be some stocks that fall short of that benchmark. Unfortunately, that's been the case for longer term T. Rowe Price Group, Inc. (NASDAQ:TROW) shareholders, since the share price is down 31% in the last three years, falling well short of the market return of around 36%. Shareholders have had an even rougher run lately, with the share price down 22% in the last 90 days. Of course, this share price action may well have been influenced by the 9.1% decline in the broader market, throughout the period.
Although the past week has been more reassuring for shareholders, they're still in the red over the last three years, so let's see if the underlying business has been responsible for the decline.
To paraphrase Benjamin Graham: Over the short term the market is a voting machine, but over the long term it's a weighing machine. One way to examine how market sentiment has changed over time is to look at the interaction between a company's share price and its earnings per share (EPS).
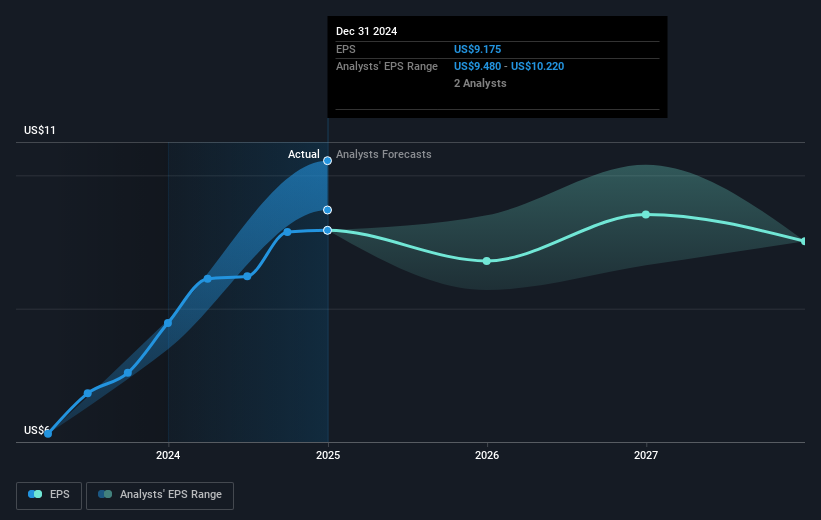
During the three years that the share price fell, T. Rowe Price Group's earnings per share (EPS) dropped by 11% each year. So do you think it's a coincidence that the share price has dropped 12% per year, a very similar rate to the EPS? We don't. So it seems like sentiment towards the stock hasn't changed all that much over time. It seems like the share price is reflecting the declining earnings per share.
You can see how EPS has changed over time in the image below (click on the chart to see the exact values).
We know that T. Rowe Price Group has improved its bottom line lately, but is it going to grow revenue? If you're interested, you could check this free report showing consensus revenue forecasts.
What About Dividends?
As well as measuring the share price return, investors should also consider the total shareholder return (TSR). The TSR incorporates the value of any spin-offs or discounted capital raisings, along with any dividends, based on the assumption that the dividends are reinvested. It's fair to say that the TSR gives a more complete picture for stocks that pay a dividend. In the case of T. Rowe Price Group, it has a TSR of -21% for the last 3 years. That exceeds its share price return that we previously mentioned. This is largely a result of its dividend payments!
A Different Perspective
Investors in T. Rowe Price Group had a tough year, with a total loss of 15% (including dividends), against a market gain of about 11%. Even the share prices of good stocks drop sometimes, but we want to see improvements in the fundamental metrics of a business, before getting too interested. Unfortunately, last year's performance may indicate unresolved challenges, given that it was worse than the annualised loss of 0.2% over the last half decade. Generally speaking long term share price weakness can be a bad sign, though contrarian investors might want to research the stock in hope of a turnaround. Most investors take the time to check the data on insider transactions. You can click here to see if insiders have been buying or selling.
Of course T. Rowe Price Group may not be the best stock to buy. So you may wish to see this free collection of growth stocks.
Please note, the market returns quoted in this article reflect the market weighted average returns of stocks that currently trade on American exchanges.
If you're looking to trade T. Rowe Price Group, open an account with the lowest-cost platform trusted by professionals, Interactive Brokers.
With clients in over 200 countries and territories, and access to 160 markets, IBKR lets you trade stocks, options, futures, forex, bonds and funds from a single integrated account.
Enjoy no hidden fees, no account minimums, and FX conversion rates as low as 0.03%, far better than what most brokers offer.
Sponsored ContentValuation is complex, but we're here to simplify it.
Discover if T. Rowe Price Group might be undervalued or overvalued with our detailed analysis, featuring fair value estimates, potential risks, dividends, insider trades, and its financial condition.
Access Free AnalysisHave feedback on this article? Concerned about the content? Get in touch with us directly. Alternatively, email editorial-team (at) simplywallst.com.
This article by Simply Wall St is general in nature. We provide commentary based on historical data and analyst forecasts only using an unbiased methodology and our articles are not intended to be financial advice. It does not constitute a recommendation to buy or sell any stock, and does not take account of your objectives, or your financial situation. We aim to bring you long-term focused analysis driven by fundamental data. Note that our analysis may not factor in the latest price-sensitive company announcements or qualitative material. Simply Wall St has no position in any stocks mentioned.
About NasdaqGS:TROW
6 star dividend payer and undervalued.
Similar Companies
Market Insights

Community Narratives

