Advertisement
- United States
- /
- Capital Markets
- /
- NasdaqGS:IBKR
Is Interactive Brokers Still Worth the Premium After a 47.2% Year-to-Date Surge in 2025?

Simply Wall St
Reviewed by Bailey Pemberton
If you’re scratching your head about what’s next for Interactive Brokers Group, you’re definitely not alone. It’s a name that’s turned plenty of heads in the investment world, and for good reason: while the S&P 500 has had its ups and downs, IBKR has quietly—or maybe not so quietly—climbed 47.2% year-to-date and a jaw-dropping 478.9% over the past five years. That surge hasn’t exactly gone unnoticed. Most recently, a wave of industry chatter around ongoing advances in trading technology and tighter regulatory scrutiny has kept the spotlight firmly on the online brokerage sector, stirring discussion about both growth potential and evolving risks.
But what does all this mean if you’re weighing whether to hold, buy, or walk away? Despite the long-term momentum, IBKR’s short-term moves have been less dramatic, with a slight dip of 2.0% over the past week, but a solid gain of 2.6% across the last month. There hasn’t been a single catalyst behind these shifts; rather, it’s a confluence of macroeconomic trends and changing investor sentiment toward financial platforms, as major banks debate commission models and where clients are best served.
Now, if you’re all about numbers, here’s a reality check: using six widely respected valuation criteria, Interactive Brokers clocks in with a value score of 0, meaning it’s not currently undervalued by any of these standard metrics. Don’t let that shut the door on your curiosity, though. Next, we’ll break down exactly how these valuation methods view the company, and why sometimes even a perfect “score” isn’t the whole story. Stick around, because there’s a smarter, more nuanced angle on valuation that deserves your attention before you make the call.
Interactive Brokers Group scores just 0/6 on our valuation checks. See what other red flags we found in the full valuation breakdown.
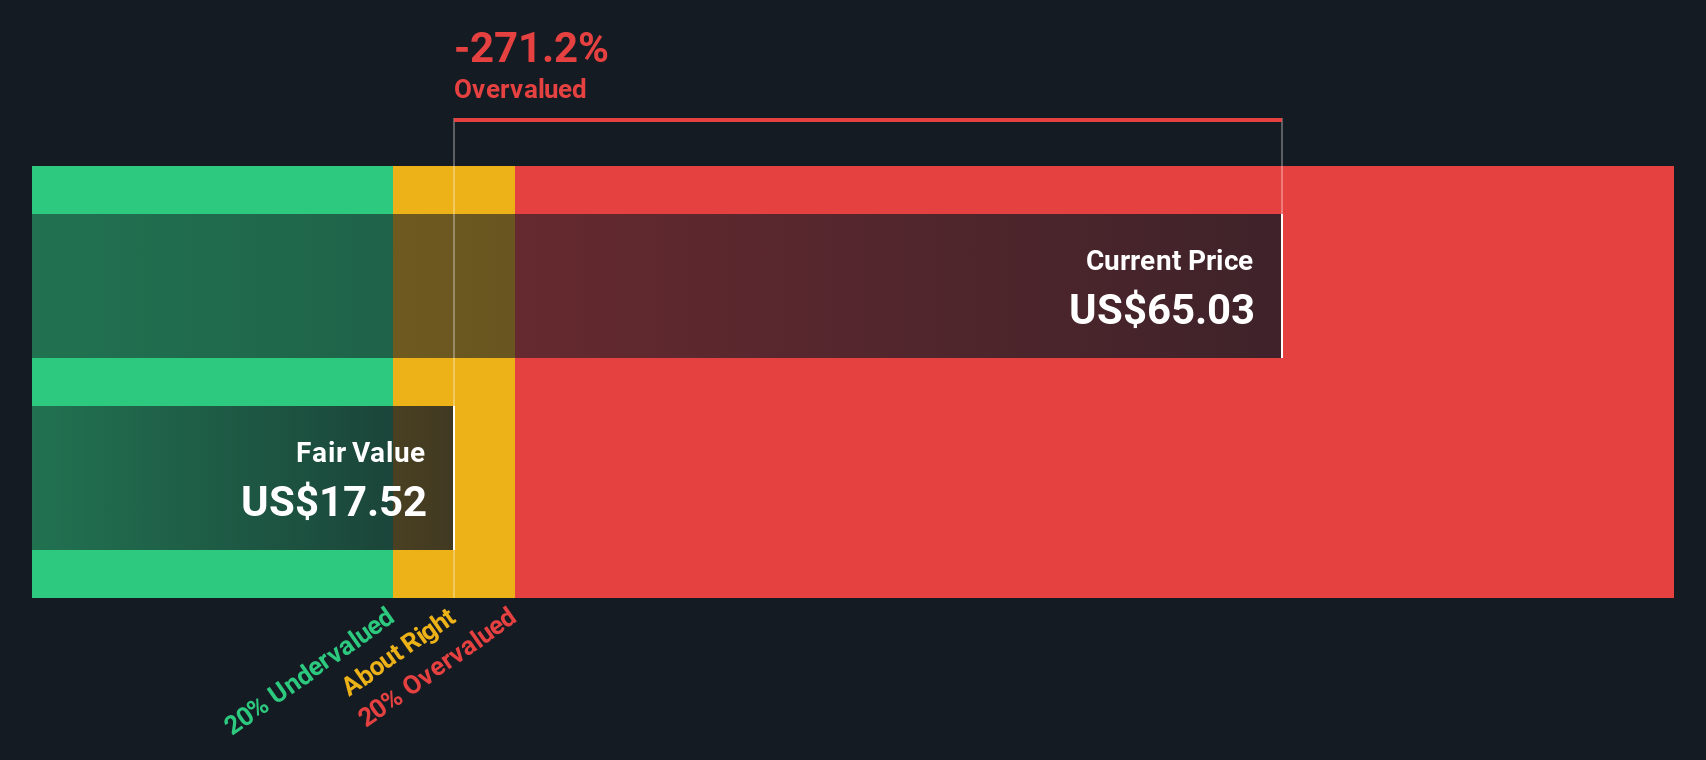
Approach 1: Interactive Brokers Group Excess Returns Analysis
The Excess Returns model takes a close look at how much profit a company can earn over and above its cost of equity, using Book Value and future earnings power to estimate fair value. This approach helps investors assess whether the firm is creating value beyond what shareholders could expect from a simple investment in the market.
For Interactive Brokers Group, there are several key figures to highlight:
- Book Value: $11.50 per share
- Stable Earnings Per Share (EPS): $2.41 per share
(Source: Weighted future Return on Equity estimates from 5 analysts.) - Cost of Equity: $1.19 per share
- Excess Return: $1.22 per share
- Average Return on Equity: 17.59%
- Stable Book Value: $13.72 per share
(Source: Weighted future Book Value estimates from 2 analysts.)
Plugging these numbers into the model, the intrinsic value for Interactive Brokers Group currently sits well below the prevailing market price. The model's outcome suggests the stock is about 89.4% overvalued based on its long-term excess returns potential. This means investors are paying a substantial premium right now, even after accounting for robust profitability and future growth.
Result: OVERVALUED
Our Excess Returns analysis suggests Interactive Brokers Group may be overvalued by 89.4%. Find undervalued stocks or create your own screener to find better value opportunities.
Approach 2: Interactive Brokers Group Price vs Earnings
The Price-to-Earnings (PE) ratio is a time-tested way to value profitable companies because it puts the current stock price in the context of how much the business is actually earning. For mature, consistently profitable businesses like Interactive Brokers Group, the PE ratio offers a clear snapshot of what investors are willing to pay for each dollar of earnings.
Of course, a “normal” or “fair” PE ratio is shaped by expectations about how much a company will grow and the risks it might face. Higher growth prospects or a more stable business often justify a higher PE ratio, while slower growers or riskier companies typically trade at lower PEs. So, looking at context is key.
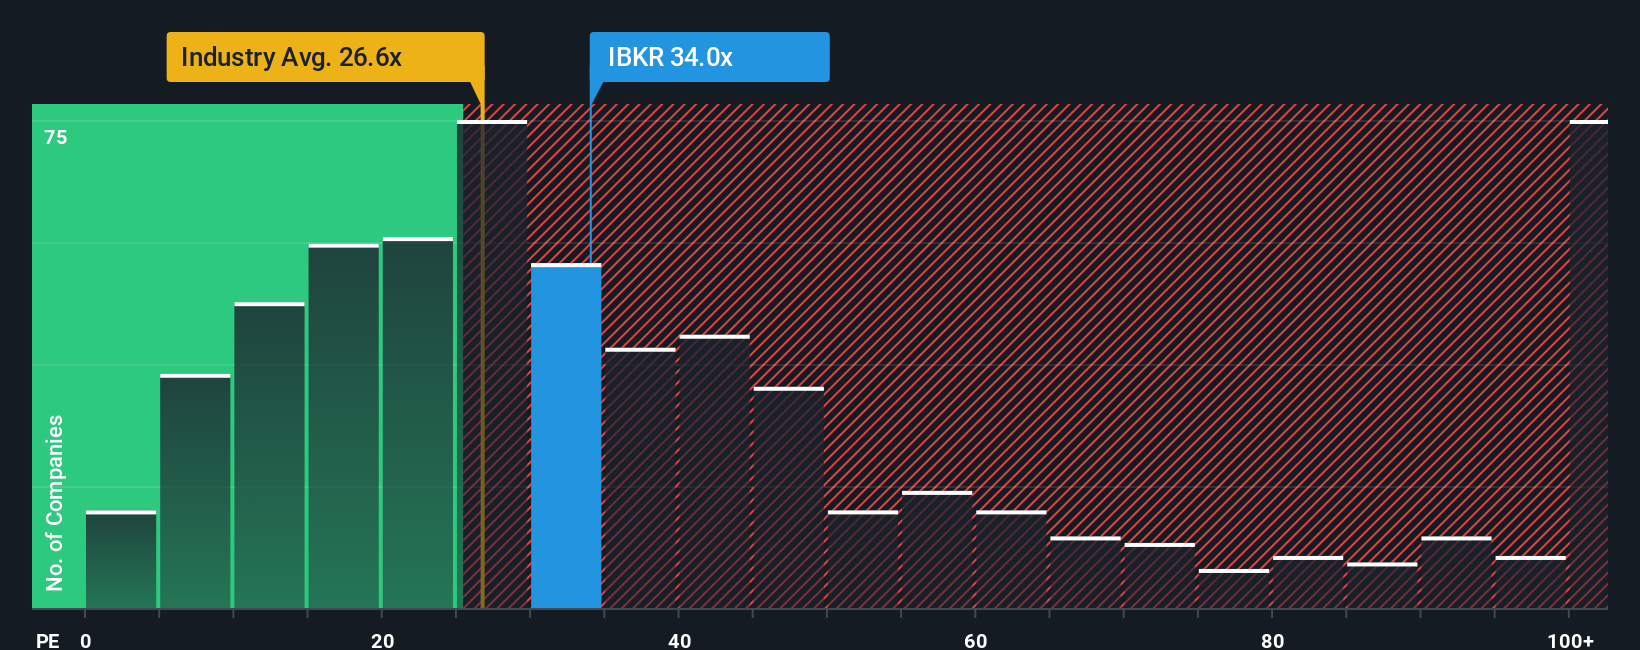
Right now, Interactive Brokers trades at a PE ratio of 32.6x, which is higher than the Capital Markets industry average PE of 26.1x and also above the average for its closest peers at 30.1x. This might suggest the stock is priced on the expensive side. But that is only half the story.
Simply Wall St’s proprietary “Fair Ratio” tackles these nuances by blending in expectations for the company’s earnings growth, its risk profile, profit margins, industry, and size. For IBKR, the Fair Ratio is 21.8x. This figure provides a more tailored valuation target than straightforward peer or industry averages. Because the Fair Ratio considers a comprehensive set of factors, rather than just simple comparisons, it delivers a more personalized gauge of what investors should pay.
Comparing Interactive Brokers’ actual PE ratio of 32.6x to its Fair Ratio of 21.8x points to a meaningful premium. By this measure, IBKR is trading well above what its fundamentals would typically warrant.
Result: OVERVALUED
PE ratios tell one story, but what if the real opportunity lies elsewhere? Discover companies where insiders are betting big on explosive growth.
Upgrade Your Decision Making: Choose your Interactive Brokers Group Narrative
Earlier we mentioned that there is an even better way to understand valuation, so let's introduce you to Narratives, a smarter, more intuitive approach available to millions of investors on Simply Wall St's Community page.
A Narrative is essentially your story or perspective behind the numbers, connecting what you believe about a company's products, future growth, and risks directly to your forecasts for revenue, earnings, margins, and ultimately its fair value.
By building a Narrative, you tie together a company’s journey, explaining why it will succeed or struggle, with a dynamic financial forecast, creating a living estimate of what the business should be worth.
The real power is that Narratives update automatically when new information, like breaking news or earnings reports, arrives, ensuring your valuation is always in sync with the latest facts.
This makes it easy to compare your Fair Value to the current market price and decide whether to buy, hold, or sell, all based on a story that is truly your own.
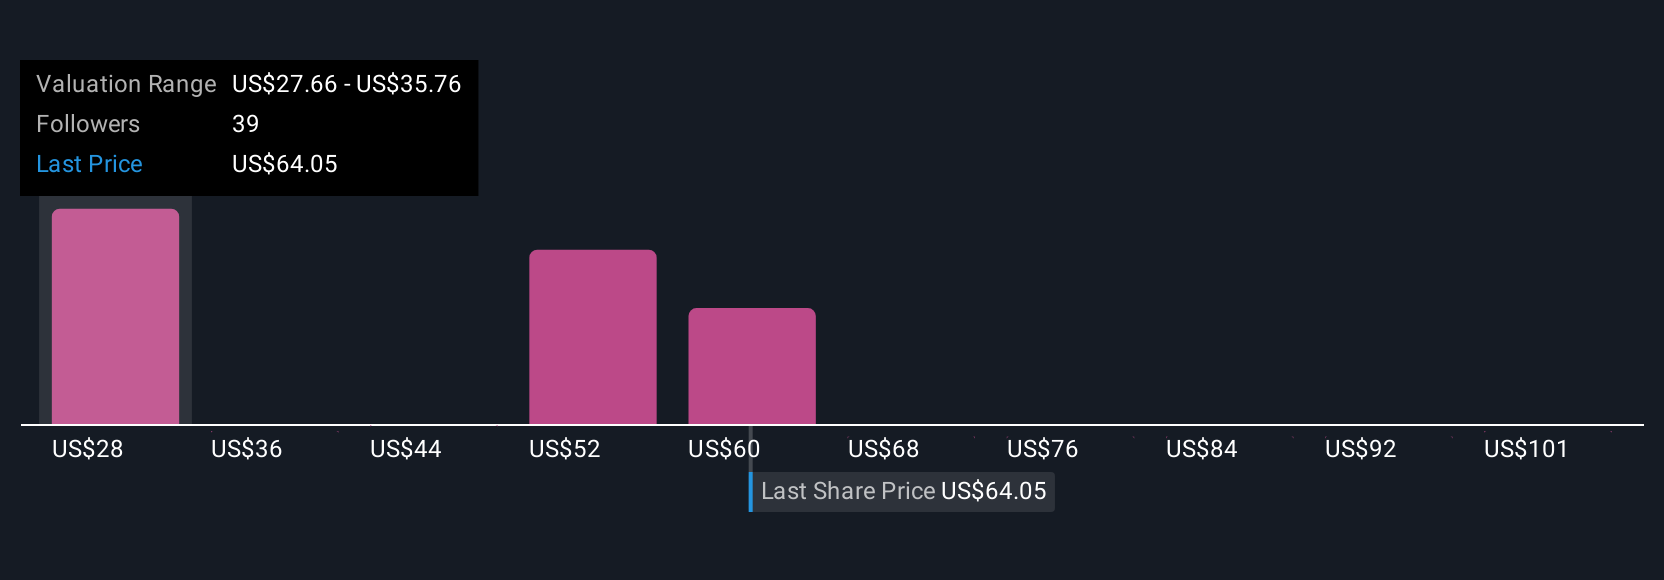
For example, recent Interactive Brokers Group Narratives from different investors have set fair value anywhere between $140 and $288 per share, showing that everyone’s view can be unique and tailored to their own expectations and insights.
Do you think there's more to the story for Interactive Brokers Group? Create your own Narrative to let the Community know!
This article by Simply Wall St is general in nature. We provide commentary based on historical data and analyst forecasts only using an unbiased methodology and our articles are not intended to be financial advice. It does not constitute a recommendation to buy or sell any stock, and does not take account of your objectives, or your financial situation. We aim to bring you long-term focused analysis driven by fundamental data. Note that our analysis may not factor in the latest price-sensitive company announcements or qualitative material. Simply Wall St has no position in any stocks mentioned.
New: AI Stock Screener & Alerts
Our new AI Stock Screener scans the market every day to uncover opportunities.
• Dividend Powerhouses (3%+ Yield)
• Undervalued Small Caps with Insider Buying
• High growth Tech and AI Companies
Or build your own from over 50 metrics.
Have feedback on this article? Concerned about the content? Get in touch with us directly. Alternatively, email editorial-team@simplywallst.com
About NasdaqGS:IBKR
Interactive Brokers Group
Operates as an automated electronic broker in the United States and internationally.
Solid track record with adequate balance sheet.
Similar Companies
Market Insights

Advertisement
Community Narratives
Finding The True Value Of A Logistics Powerhouse
Fair Value US$95.21|8.6% undervalued
NV
Community Contributor
Paradigm Biopharmaceuticals Will Lead Osteoarthritis Treatment with Zilosul's FDA Success
Fair Value AU$5.50|92.1% undervalued
AM
Community Contributor
Barrick Mining (ABX:CA): A Gold Hedge against a U.S. Shutdown
Fair Value CA$60.00|25.6% undervalued
GM
Community Contributor