Freedom Holding (NasdaqCM:FRHC) has caught the attention of investors recently, thanks to its impressive run over the past year. Shares are up nearly 76% year-over-year, sparking conversations about what is fueling the momentum.
While there haven't been headline-making news events lately, Freedom Holding's momentum is tough to ignore. After a year of steady gains, the company now boasts a 1-year total shareholder return of nearly 76%, reflecting growing optimism among investors about its long-term growth prospects. In the short term, the share price continues to ride high, reinforcing the sense that confidence in the business is building rather than fading.
But with the stock at fresh highs and boasting strong long-term returns, some investors may wonder whether the current price allows for further upside. It is possible the market is already factoring in all of Freedom Holding’s future growth.
Advertisement
Price-to-Earnings of 131.1x: Is it justified?
Freedom Holding trades at a price-to-earnings (P/E) ratio of 131.1x, a level far above both the financial sector and wider US market averages. At the last close of $172.67, this valuation implies investors are paying a very steep premium for each dollar of current earnings.
The P/E ratio reflects how much shareholders are willing to pay for a company's net profit. High P/E multiples can sometimes be justified by robust growth expectations, strong profitability, or a unique market position. However, they can also signal over-optimism if earnings are stagnant or declining.
In Freedom Holding's case, the company's P/E of 131.1x is much higher than the average US Capital Markets industry P/E of 26.3x and significantly higher than the P/E ratios seen in its peer group, which average 18.9x. While the company boasts five-year earnings growth, its most recent annual profit dropped by 76.4 percent, with declining margins and a return on equity considered low for the industry. This suggests the market might be pricing in a dramatic turnaround, despite recent headwinds.
However, any unexpected drop in profitability or further decline in margins could quickly reduce investor enthusiasm and put pressure on the share price.
Another View: Discounted Cash Flow Paints a Different Picture
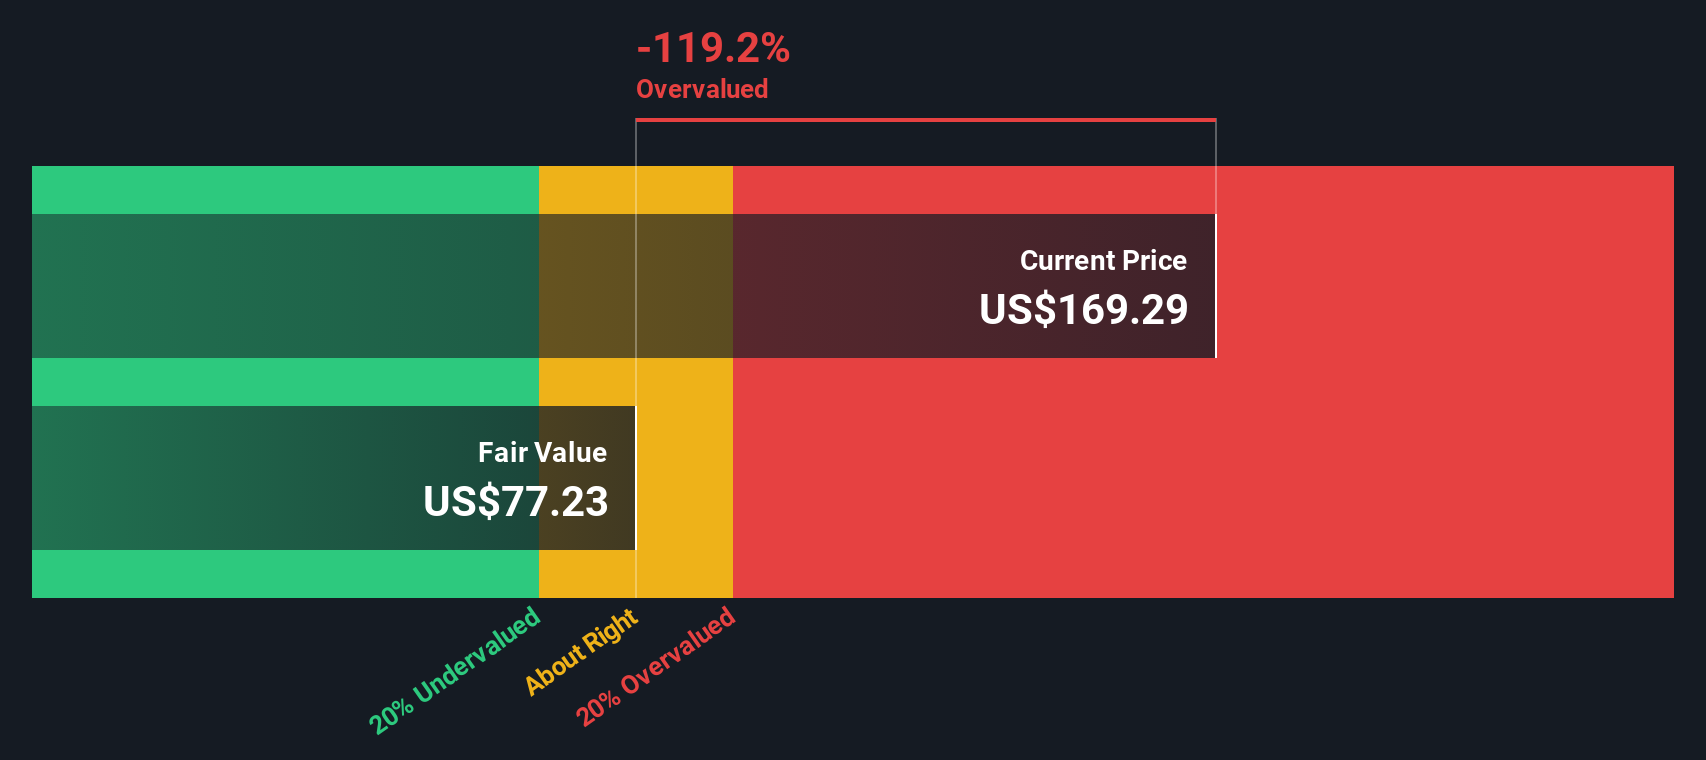
For a second opinion, the SWS DCF model suggests Freedom Holding might not just be expensive, but dramatically so. At $172.67 per share, the stock trades well above the DCF fair value estimate of $77.62. If the DCF is correct, the market could be due for a reality check.
Simply Wall St performs a discounted cash flow (DCF) on every stock in the world every day (check out Freedom Holding for example). We show the entire calculation in full. You can track the result in your watchlist or portfolio and be alerted when this changes, or use our stock screener to discover undervalued stocks based on their cash flows. If you save a screener we even alert you when new companies match - so you never miss a potential opportunity.
Build Your Own Freedom Holding Narrative
If you see the story differently or want to dig into the numbers and build your perspective, it's quick and easy to create your own narrative. Do it your way.
A great starting point for your Freedom Holding research is our analysis highlighting 2 important warning signs that could impact your investment decision.
Looking for more investment ideas?
Smart investors never settle for just one opportunity. Use the Simply Wall Street Screener to reveal hidden gems and fresh possibilities that others might be missing.
Unlock the advantage of regular cash flow and pursue income with these 19 dividend stocks with yields > 3% offering robust yields above 3% from companies committed to rewarding shareholders.
Target companies pioneering innovation and medical progress by checking out these 31 healthcare AI stocks powering the future of healthcare with real, data-driven breakthroughs.
Seize the edge in tomorrow’s financial landscape and track these 78 cryptocurrency and blockchain stocks that are capitalizing on the surge in digital assets and blockchain advancement.
This article by Simply Wall St is general in nature. We provide commentary based on historical data
and analyst forecasts only using an unbiased methodology and our articles are not intended to be financial advice. It does not constitute a recommendation to buy or sell any stock, and does not take account of your objectives, or your
financial situation. We aim to bring you long-term focused analysis driven by fundamental data.
Note that our analysis may not factor in the latest price-sensitive company announcements or qualitative material.
Simply Wall St has no position in any stocks mentioned.
New: AI Stock Screener & Alerts
Our new AI Stock Screener scans the market every day to uncover opportunities.
• Dividend Powerhouses (3%+ Yield) • Undervalued Small Caps with Insider Buying • High growth Tech and AI Companies