- United States
- /
- Hospitality
- /
- NYSE:YUM
Yum! Brands, Inc.'s (NYSE:YUM) Intrinsic Value Is Potentially 26% Below Its Share Price


Key Insights
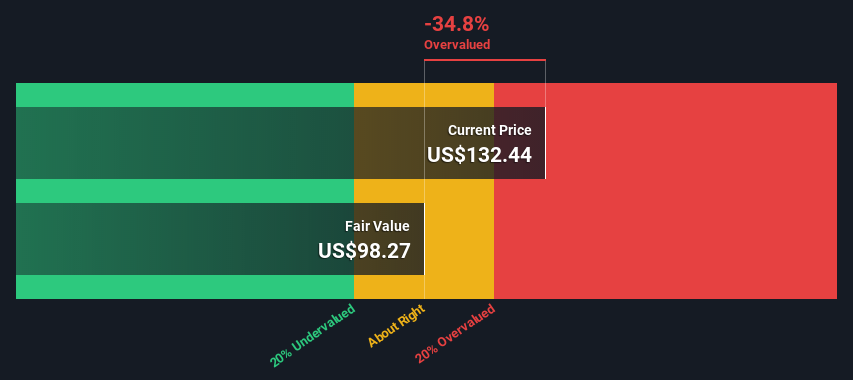
- Yum! Brands' estimated fair value is US$98.27 based on 2 Stage Free Cash Flow to Equity
- Yum! Brands' US$132 share price signals that it might be 35% overvalued
- Analyst price target for YUM is US$147, which is 50% above our fair value estimate
In this article we are going to estimate the intrinsic value of Yum! Brands, Inc. (NYSE:YUM) by taking the expected future cash flows and discounting them to today's value. We will take advantage of the Discounted Cash Flow (DCF) model for this purpose. Don't get put off by the jargon, the math behind it is actually quite straightforward.
We generally believe that a company's value is the present value of all of the cash it will generate in the future. However, a DCF is just one valuation metric among many, and it is not without flaws. For those who are keen learners of equity analysis, the Simply Wall St analysis model here may be something of interest to you.
View our latest analysis for Yum! Brands
Is Yum! Brands Fairly Valued?
We use what is known as a 2-stage model, which simply means we have two different periods of growth rates for the company's cash flows. Generally the first stage is higher growth, and the second stage is a lower growth phase. To begin with, we have to get estimates of the next ten years of cash flows. Where possible we use analyst estimates, but when these aren't available we extrapolate the previous free cash flow (FCF) from the last estimate or reported value. We assume companies with shrinking free cash flow will slow their rate of shrinkage, and that companies with growing free cash flow will see their growth rate slow, over this period. We do this to reflect that growth tends to slow more in the early years than it does in later years.
A DCF is all about the idea that a dollar in the future is less valuable than a dollar today, and so the sum of these future cash flows is then discounted to today's value:
10-year free cash flow (FCF) estimate
| 2023 | 2024 | 2025 | 2026 | 2027 | 2028 | 2029 | 2030 | 2031 | 2032 | |
| Levered FCF ($, Millions) | US$1.48b | US$1.69b | US$1.85b | US$1.98b | US$2.08b | US$2.17b | US$2.25b | US$2.33b | US$2.39b | US$2.46b |
| Growth Rate Estimate Source | Analyst x6 | Analyst x5 | Analyst x2 | Est @ 6.70% | Est @ 5.32% | Est @ 4.36% | Est @ 3.68% | Est @ 3.21% | Est @ 2.88% | Est @ 2.65% |
| Present Value ($, Millions) Discounted @ 9.2% | US$1.4k | US$1.4k | US$1.4k | US$1.4k | US$1.3k | US$1.3k | US$1.2k | US$1.2k | US$1.1k | US$1.0k |
("Est" = FCF growth rate estimated by Simply Wall St)
Present Value of 10-year Cash Flow (PVCF) = US$13b
The second stage is also known as Terminal Value, this is the business's cash flow after the first stage. The Gordon Growth formula is used to calculate Terminal Value at a future annual growth rate equal to the 5-year average of the 10-year government bond yield of 2.1%. We discount the terminal cash flows to today's value at a cost of equity of 9.2%.
Terminal Value (TV)= FCF2032 × (1 + g) ÷ (r – g) = US$2.5b× (1 + 2.1%) ÷ (9.2%– 2.1%) = US$36b
Present Value of Terminal Value (PVTV)= TV / (1 + r)10= US$36b÷ ( 1 + 9.2%)10= US$15b
The total value, or equity value, is then the sum of the present value of the future cash flows, which in this case is US$28b. To get the intrinsic value per share, we divide this by the total number of shares outstanding. Compared to the current share price of US$132, the company appears potentially overvalued at the time of writing. Valuations are imprecise instruments though, rather like a telescope - move a few degrees and end up in a different galaxy. Do keep this in mind.
Important Assumptions
Now the most important inputs to a discounted cash flow are the discount rate, and of course, the actual cash flows. If you don't agree with these result, have a go at the calculation yourself and play with the assumptions. The DCF also does not consider the possible cyclicality of an industry, or a company's future capital requirements, so it does not give a full picture of a company's potential performance. Given that we are looking at Yum! Brands as potential shareholders, the cost of equity is used as the discount rate, rather than the cost of capital (or weighted average cost of capital, WACC) which accounts for debt. In this calculation we've used 9.2%, which is based on a levered beta of 1.186. Beta is a measure of a stock's volatility, compared to the market as a whole. We get our beta from the industry average beta of globally comparable companies, with an imposed limit between 0.8 and 2.0, which is a reasonable range for a stable business.
SWOT Analysis for Yum! Brands
- Debt is well covered by earnings.
- Dividends are covered by earnings and cash flows.
- Earnings declined over the past year.
- Dividend is low compared to the top 25% of dividend payers in the Hospitality market.
- Expensive based on P/E ratio and estimated fair value.
- Annual earnings are forecast to grow for the next 3 years.
- Debt is not well covered by operating cash flow.
- Total liabilities exceed total assets, which raises the risk of financial distress.
- Annual earnings are forecast to grow slower than the American market.
Looking Ahead:
Although the valuation of a company is important, it shouldn't be the only metric you look at when researching a company. It's not possible to obtain a foolproof valuation with a DCF model. Preferably you'd apply different cases and assumptions and see how they would impact the company's valuation. If a company grows at a different rate, or if its cost of equity or risk free rate changes sharply, the output can look very different. Can we work out why the company is trading at a premium to intrinsic value? For Yum! Brands, we've compiled three essential elements you should explore:
- Risks: Consider for instance, the ever-present spectre of investment risk. We've identified 3 warning signs with Yum! Brands (at least 2 which are potentially serious) , and understanding these should be part of your investment process.
- Future Earnings: How does YUM's growth rate compare to its peers and the wider market? Dig deeper into the analyst consensus number for the upcoming years by interacting with our free analyst growth expectation chart.
- Other High Quality Alternatives: Do you like a good all-rounder? Explore our interactive list of high quality stocks to get an idea of what else is out there you may be missing!
PS. The Simply Wall St app conducts a discounted cash flow valuation for every stock on the NYSE every day. If you want to find the calculation for other stocks just search here.
New: Manage All Your Stock Portfolios in One Place
We've created the ultimate portfolio companion for stock investors, and it's free.
• Connect an unlimited number of Portfolios and see your total in one currency
• Be alerted to new Warning Signs or Risks via email or mobile
• Track the Fair Value of your stocks
Have feedback on this article? Concerned about the content? Get in touch with us directly. Alternatively, email editorial-team (at) simplywallst.com.
This article by Simply Wall St is general in nature. We provide commentary based on historical data and analyst forecasts only using an unbiased methodology and our articles are not intended to be financial advice. It does not constitute a recommendation to buy or sell any stock, and does not take account of your objectives, or your financial situation. We aim to bring you long-term focused analysis driven by fundamental data. Note that our analysis may not factor in the latest price-sensitive company announcements or qualitative material. Simply Wall St has no position in any stocks mentioned.
About NYSE:YUM
Yum! Brands
Develops, operates, and franchises quick service restaurants worldwide.
Average dividend payer low.

