
Advertisement

Key Insights
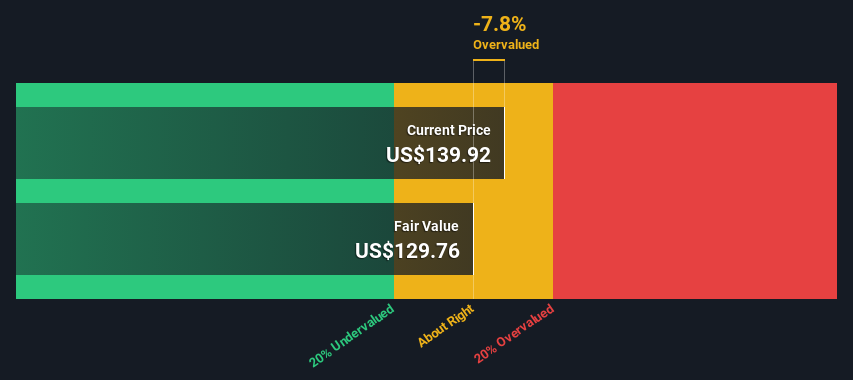
- Yum! Brands' estimated fair value is US$130 based on 2 Stage Free Cash Flow to Equity
- Current share price of US$140 suggests Yum! Brands is potentially trading close to its fair value
- The US$146 analyst price target for YUM is 13% more than our estimate of fair value
Does the September share price for Yum! Brands, Inc. (NYSE:YUM) reflect what it's really worth? Today, we will estimate the stock's intrinsic value by taking the forecast future cash flows of the company and discounting them back to today's value. One way to achieve this is by employing the Discounted Cash Flow (DCF) model. Don't get put off by the jargon, the math behind it is actually quite straightforward.
We would caution that there are many ways of valuing a company and, like the DCF, each technique has advantages and disadvantages in certain scenarios. Anyone interested in learning a bit more about intrinsic value should have a read of the Simply Wall St analysis model.
See our latest analysis for Yum! Brands
The Calculation
We're using the 2-stage growth model, which simply means we take in account two stages of company's growth. In the initial period the company may have a higher growth rate and the second stage is usually assumed to have a stable growth rate. To begin with, we have to get estimates of the next ten years of cash flows. Where possible we use analyst estimates, but when these aren't available we extrapolate the previous free cash flow (FCF) from the last estimate or reported value. We assume companies with shrinking free cash flow will slow their rate of shrinkage, and that companies with growing free cash flow will see their growth rate slow, over this period. We do this to reflect that growth tends to slow more in the early years than it does in later years.
A DCF is all about the idea that a dollar in the future is less valuable than a dollar today, so we need to discount the sum of these future cash flows to arrive at a present value estimate:
10-year free cash flow (FCF) estimate
| 2025 | 2026 | 2027 | 2028 | 2029 | 2030 | 2031 | 2032 | 2033 | 2034 | |
| Levered FCF ($, Millions) | US$1.71b | US$1.83b | US$1.93b | US$2.01b | US$2.09b | US$2.16b | US$2.23b | US$2.29b | US$2.36b | US$2.42b |
| Growth Rate Estimate Source | Analyst x4 | Analyst x1 | Est @ 5.11% | Est @ 4.33% | Est @ 3.78% | Est @ 3.39% | Est @ 3.13% | Est @ 2.94% | Est @ 2.81% | Est @ 2.71% |
| Present Value ($, Millions) Discounted @ 7.7% | US$1.6k | US$1.6k | US$1.5k | US$1.5k | US$1.4k | US$1.4k | US$1.3k | US$1.3k | US$1.2k | US$1.1k |
("Est" = FCF growth rate estimated by Simply Wall St)
Present Value of 10-year Cash Flow (PVCF) = US$14b
After calculating the present value of future cash flows in the initial 10-year period, we need to calculate the Terminal Value, which accounts for all future cash flows beyond the first stage. For a number of reasons a very conservative growth rate is used that cannot exceed that of a country's GDP growth. In this case we have used the 5-year average of the 10-year government bond yield (2.5%) to estimate future growth. In the same way as with the 10-year 'growth' period, we discount future cash flows to today's value, using a cost of equity of 7.7%.
Terminal Value (TV)= FCF2034 × (1 + g) ÷ (r – g) = US$2.4b× (1 + 2.5%) ÷ (7.7%– 2.5%) = US$47b
Present Value of Terminal Value (PVTV)= TV / (1 + r)10= US$47b÷ ( 1 + 7.7%)10= US$23b
The total value, or equity value, is then the sum of the present value of the future cash flows, which in this case is US$36b. The last step is to then divide the equity value by the number of shares outstanding. Relative to the current share price of US$140, the company appears around fair value at the time of writing. Remember though, that this is just an approximate valuation, and like any complex formula - garbage in, garbage out.
The Assumptions
Now the most important inputs to a discounted cash flow are the discount rate, and of course, the actual cash flows. Part of investing is coming up with your own evaluation of a company's future performance, so try the calculation yourself and check your own assumptions. The DCF also does not consider the possible cyclicality of an industry, or a company's future capital requirements, so it does not give a full picture of a company's potential performance. Given that we are looking at Yum! Brands as potential shareholders, the cost of equity is used as the discount rate, rather than the cost of capital (or weighted average cost of capital, WACC) which accounts for debt. In this calculation we've used 7.7%, which is based on a levered beta of 1.269. Beta is a measure of a stock's volatility, compared to the market as a whole. We get our beta from the industry average beta of globally comparable companies, with an imposed limit between 0.8 and 2.0, which is a reasonable range for a stable business.
SWOT Analysis for Yum! Brands
Strength
- Earnings growth over the past year exceeded its 5-year average.
- Debt is well covered by earnings.
- Dividends are covered by earnings and cash flows.
Weakness
- Earnings growth over the past year underperformed the Hospitality industry.
- Dividend is low compared to the top 25% of dividend payers in the Hospitality market.
- Expensive based on P/E ratio and estimated fair value.
Opportunity
- Annual earnings are forecast to grow for the next 3 years.
Threat
- Debt is not well covered by operating cash flow.
- Total liabilities exceed total assets, which raises the risk of financial distress.
- Annual earnings are forecast to grow slower than the American market.
Next Steps:
Valuation is only one side of the coin in terms of building your investment thesis, and it ideally won't be the sole piece of analysis you scrutinize for a company. It's not possible to obtain a foolproof valuation with a DCF model. Preferably you'd apply different cases and assumptions and see how they would impact the company's valuation. If a company grows at a different rate, or if its cost of equity or risk free rate changes sharply, the output can look very different. For Yum! Brands, there are three fundamental factors you should further research:
- Risks: Case in point, we've spotted 4 warning signs for Yum! Brands you should be aware of, and 2 of them shouldn't be ignored.
- Future Earnings: How does YUM's growth rate compare to its peers and the wider market? Dig deeper into the analyst consensus number for the upcoming years by interacting with our free analyst growth expectation chart.
- Other High Quality Alternatives: Do you like a good all-rounder? Explore our interactive list of high quality stocks to get an idea of what else is out there you may be missing!
PS. Simply Wall St updates its DCF calculation for every American stock every day, so if you want to find the intrinsic value of any other stock just search here.
New: Manage All Your Stock Portfolios in One Place
We've created the ultimate portfolio companion for stock investors, and it's free.
• Connect an unlimited number of Portfolios and see your total in one currency
• Be alerted to new Warning Signs or Risks via email or mobile
• Track the Fair Value of your stocks
Have feedback on this article? Concerned about the content? Get in touch with us directly. Alternatively, email editorial-team (at) simplywallst.com.
This article by Simply Wall St is general in nature. We provide commentary based on historical data and analyst forecasts only using an unbiased methodology and our articles are not intended to be financial advice. It does not constitute a recommendation to buy or sell any stock, and does not take account of your objectives, or your financial situation. We aim to bring you long-term focused analysis driven by fundamental data. Note that our analysis may not factor in the latest price-sensitive company announcements or qualitative material. Simply Wall St has no position in any stocks mentioned.
About NYSE:YUM
Yum! Brands
Develops, operates, and franchises quick service restaurants worldwide.
Average dividend payer low.
Similar Companies
Market Insights

Advertisement
Community Narratives
MicroStrategy: Volatile Gamble or Golden Opportunity?
Fair Value US$663.00|36.2% undervalued
BL
Community Contributor
Emerging Markets and Debt Reduction Will Propel Bath & Body Works Forward
Fair Value US$40.73|22.0% undervalued
ZW
Community Contributor
An amazing opportunity to potentially get a 100 bagger
Fair Value US$10.00|46.4% overvalued
DA
Community Contributor