Advertisement
- United States
- /
- Hospitality
- /
- NYSE:MCD
Is There Still Value in McDonald's After Its Five Year 60.9% Stock Climb?

Simply Wall St
Reviewed by Bailey Pemberton
Thinking about what to do with your McDonald's shares, or whether now might be the right time to jump in? You are not alone. Despite a few bumps, like the slight -0.7% dip over the last week, McDonald's stock has shown some steady gains, climbing 0.5% over the last month and delivering a respectable 4.5% year-to-date return. Stretch that out to the past five years, and the golden arches have returned an impressive 60.9%. Some would say that is a sign of strength, buoyed recently by ongoing brand expansions and investments in digital channels. Consumer shifts toward convenience and delivery, particularly relevant in post-pandemic life, have only reinforced McDonald's position, helping keep risk perceptions in check even through market volatility.
With the latest value score coming in at 2 out of 6, there are definitely questions around whether the stock is undervalued right now. Only two boxes get checked when it comes to classic undervaluation signals, suggesting the current price might reflect most of the company's strengths already. In a moment, we will break down those valuation checks in detail to see exactly how McDonald's stacks up. Stick around, because at the end of the article, we will look at an even better way to spot value that goes beyond the usual methods.
McDonald's scores just 2/6 on our valuation checks. See what other red flags we found in the full valuation breakdown.
Approach 1: McDonald's Discounted Cash Flow (DCF) Analysis
The Discounted Cash Flow (DCF) model estimates a company’s value by projecting the cash it will generate in the future and discounting those cash flows back to today’s dollar value. This gives investors a sense of what a business might be worth on a fundamental basis, using expected cash generation rather than current market sentiment.
For McDonald’s, the most recent twelve months produced roughly $7.2 Billion in Free Cash Flow. Analyst estimates see this figure climbing to $10.6 Billion by 2028. Beyond 2028, projections are extrapolated, suggesting continued but stabilizing growth in annual free cash flows over the next decade. All figures are in US Dollars.
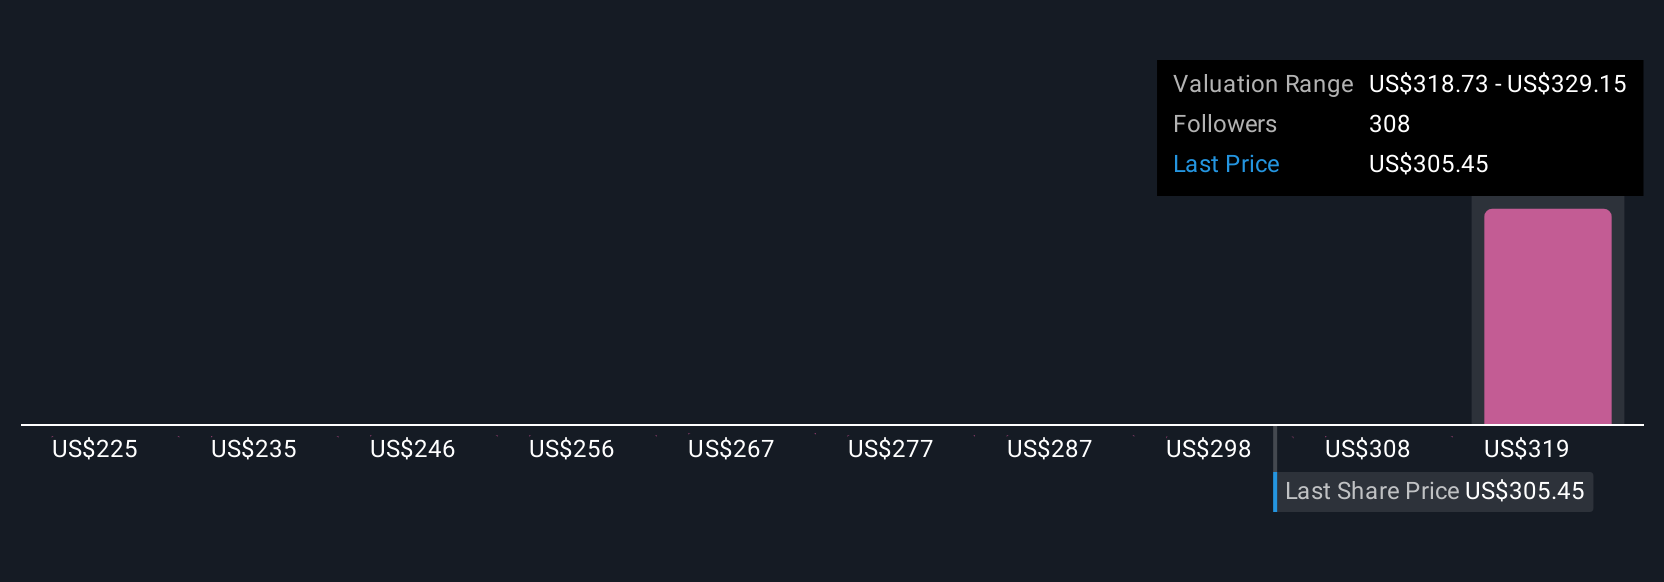
Based on this model, the estimated intrinsic value for McDonald’s stock comes in at $249.77 per share. Compared to the current share price, this implies the stock is around 22.4% overvalued. In other words, the market price today already reflects much of McDonald’s expected future growth and earnings. Investors paying today's price are not getting a built-in bargain.
Result: OVERVALUED

Our Discounted Cash Flow (DCF) analysis suggests McDonald's may be overvalued by 22.4%. Find undervalued stocks or create your own screener to find better value opportunities.
Approach 2: McDonald's Price vs Earnings (PE)
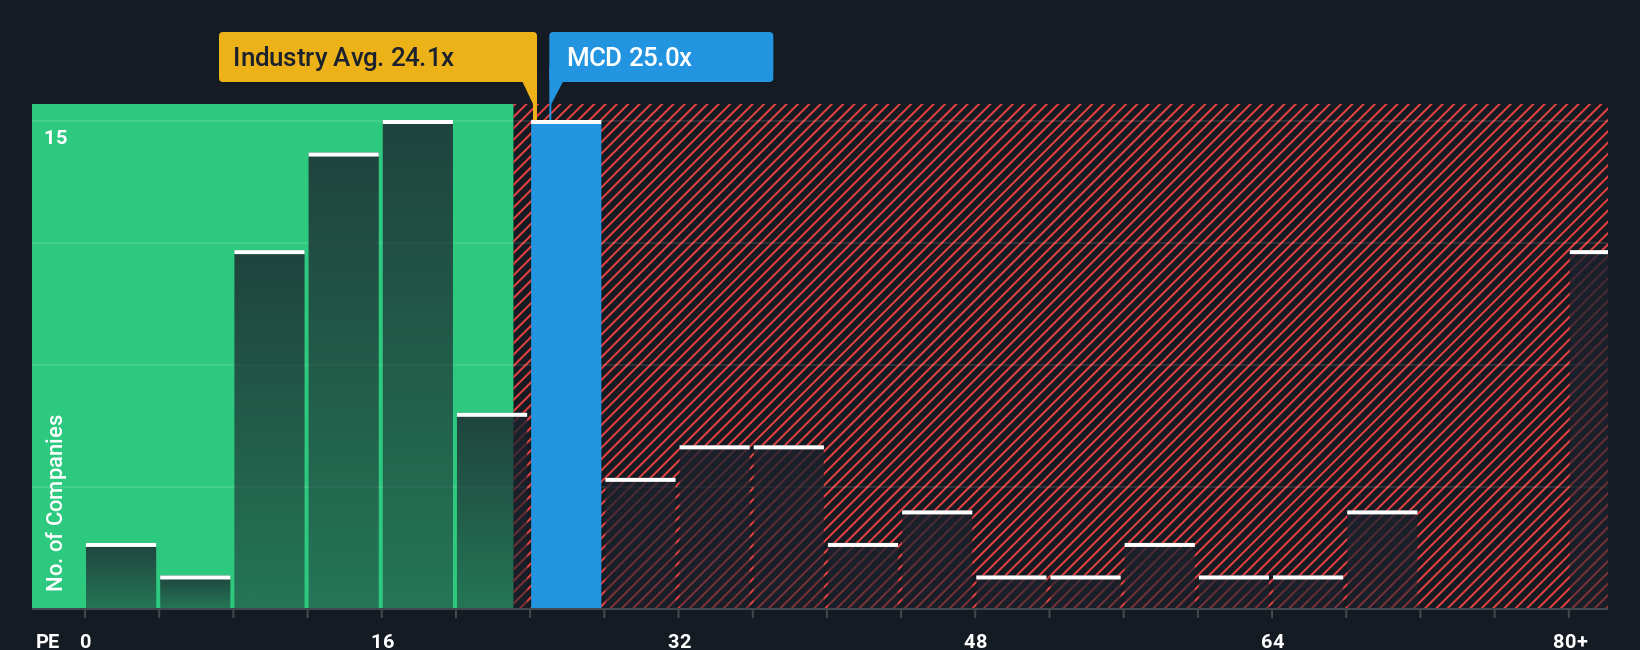
The Price-to-Earnings (PE) ratio is a favored tool for valuing companies that consistently deliver strong profits, like McDonald’s. Since it compares the company’s share price to its earnings per share, it provides an at-a-glance sense of how much investors are willing to pay for each dollar of current profit. Growth expectations and perceived risks play a big role here, as faster-growing and lower-risk businesses generally command higher PE ratios.
Currently, McDonald’s trades at a PE ratio of 26x, which stands above both the broader hospitality industry average of 23.86x and the median of its immediate peers at 60.49x. However, instead of relying solely on these benchmarks, investors should look at what Simply Wall St calls the “Fair Ratio.” This proprietary metric filters in factors such as the company’s expected earnings growth, profit margins, market cap, and risk profile alongside industry context. Unlike traditional comparisons, the Fair Ratio provides a more tailored benchmark, recognizing the company’s specific strengths and challenges rather than just how it measures up to the herd.
For McDonald’s, the Fair Ratio is assessed at 31.11x, modestly above its actual PE. This indicates that McDonald’s shares are trading a bit below what their growth and quality fundamentals might justify, but the gap is not dramatic.
Result: ABOUT RIGHT
PE ratios tell one story, but what if the real opportunity lies elsewhere? Discover companies where insiders are betting big on explosive growth.
Upgrade Your Decision Making: Choose your McDonald's Narrative
Earlier we mentioned that there is an even better way to understand valuation, so let us introduce you to Narratives. A Narrative is simply your story, your unique perspective about where McDonald’s is headed and why. It connects not just the numbers, but also your view of its future revenue, margins, and fair value.
Narratives link the big-picture story, such as expansion into emerging markets, brand innovation, or challenges facing core customers, to a financial forecast and an estimated fair value for the company. On Simply Wall St's Community page, investors of all experience levels can easily build and compare Narratives, making this dynamic tool accessible to millions worldwide.
By comparing the Fair Value in your Narrative with the current price, you can make more confident decisions on whether to buy, hold, or sell. Because Narratives instantly update with new news or earnings data, you are always working with the latest information.
For example, some McDonald's Narratives expect rapid digital expansion to drive the stock towards $373.00, while others are more cautious and value it at just $260.00 due to rising costs. This shows there is no single “right” answer, only the Narrative that makes sense to you.
Do you think there's more to the story for McDonald's? Create your own Narrative to let the Community know!
This article by Simply Wall St is general in nature. We provide commentary based on historical data and analyst forecasts only using an unbiased methodology and our articles are not intended to be financial advice. It does not constitute a recommendation to buy or sell any stock, and does not take account of your objectives, or your financial situation. We aim to bring you long-term focused analysis driven by fundamental data. Note that our analysis may not factor in the latest price-sensitive company announcements or qualitative material. Simply Wall St has no position in any stocks mentioned.
New: Manage All Your Stock Portfolios in One Place
We've created the ultimate portfolio companion for stock investors, and it's free.
• Connect an unlimited number of Portfolios and see your total in one currency
• Be alerted to new Warning Signs or Risks via email or mobile
• Track the Fair Value of your stocks
Have feedback on this article? Concerned about the content? Get in touch with us directly. Alternatively, email editorial-team@simplywallst.com
About NYSE:MCD
McDonald's
Owns, operates, and franchises restaurants under the McDonald’s brand in the United States and internationally.
Established dividend payer and slightly overvalued.
Similar Companies
Market Insights

Advertisement
Community Narratives
Finding The True Value Of A Logistics Powerhouse
Fair Value US$95.21|8.4% undervalued
NV
Community Contributor
Paradigm Biopharmaceuticals Will Lead Osteoarthritis Treatment with Zilosul's FDA Success
Fair Value AU$5.50|92.1% undervalued
AM
Community Contributor
Barrick Mining (ABX:CA): A Gold Hedge against a U.S. Shutdown
Fair Value CA$60.00|24.2% undervalued
GM
Community Contributor