- United States
- /
- Consumer Services
- /
- NYSE:HRB
Calculating The Intrinsic Value Of H&R Block, Inc. (NYSE:HRB)


Key Insights
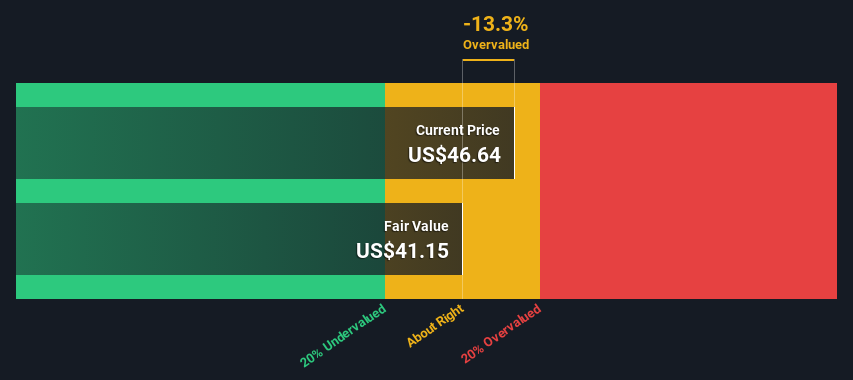
- Using the 2 Stage Free Cash Flow to Equity, H&R Block fair value estimate is US$41.15
- H&R Block's US$46.64 share price indicates it is trading at similar levels as its fair value estimate
- Analyst price target for HRB is US$49.67, which is 21% above our fair value estimate
How far off is H&R Block, Inc. (NYSE:HRB) from its intrinsic value? Using the most recent financial data, we'll take a look at whether the stock is fairly priced by taking the expected future cash flows and discounting them to their present value. We will use the Discounted Cash Flow (DCF) model on this occasion. There's really not all that much to it, even though it might appear quite complex.
We generally believe that a company's value is the present value of all of the cash it will generate in the future. However, a DCF is just one valuation metric among many, and it is not without flaws. Anyone interested in learning a bit more about intrinsic value should have a read of the Simply Wall St analysis model.
View our latest analysis for H&R Block
What's The Estimated Valuation?
We are going to use a two-stage DCF model, which, as the name states, takes into account two stages of growth. The first stage is generally a higher growth period which levels off heading towards the terminal value, captured in the second 'steady growth' period. To begin with, we have to get estimates of the next ten years of cash flows. Seeing as no analyst estimates of free cash flow are available to us, we have extrapolate the previous free cash flow (FCF) from the company's last reported value. We assume companies with shrinking free cash flow will slow their rate of shrinkage, and that companies with growing free cash flow will see their growth rate slow, over this period. We do this to reflect that growth tends to slow more in the early years than it does in later years.
Generally we assume that a dollar today is more valuable than a dollar in the future, and so the sum of these future cash flows is then discounted to today's value:
10-year free cash flow (FCF) forecast
| 2024 | 2025 | 2026 | 2027 | 2028 | 2029 | 2030 | 2031 | 2032 | 2033 | |
| Levered FCF ($, Millions) | US$458.2m | US$385.1m | US$344.7m | US$321.7m | US$308.9m | US$302.5m | US$300.1m | US$300.5m | US$302.9m | US$306.6m |
| Growth Rate Estimate Source | Est @ -23.80% | Est @ -15.97% | Est @ -10.49% | Est @ -6.66% | Est @ -3.97% | Est @ -2.09% | Est @ -0.78% | Est @ 0.14% | Est @ 0.79% | Est @ 1.24% |
| Present Value ($, Millions) Discounted @ 7.0% | US$428 | US$336 | US$281 | US$245 | US$220 | US$201 | US$186 | US$174 | US$164 | US$155 |
("Est" = FCF growth rate estimated by Simply Wall St)
Present Value of 10-year Cash Flow (PVCF) = US$2.4b
The second stage is also known as Terminal Value, this is the business's cash flow after the first stage. The Gordon Growth formula is used to calculate Terminal Value at a future annual growth rate equal to the 5-year average of the 10-year government bond yield of 2.3%. We discount the terminal cash flows to today's value at a cost of equity of 7.0%.
Terminal Value (TV)= FCF2033 × (1 + g) ÷ (r – g) = US$307m× (1 + 2.3%) ÷ (7.0%– 2.3%) = US$6.6b
Present Value of Terminal Value (PVTV)= TV / (1 + r)10= US$6.6b÷ ( 1 + 7.0%)10= US$3.3b
The total value, or equity value, is then the sum of the present value of the future cash flows, which in this case is US$5.7b. The last step is to then divide the equity value by the number of shares outstanding. Relative to the current share price of US$46.6, the company appears around fair value at the time of writing. Valuations are imprecise instruments though, rather like a telescope - move a few degrees and end up in a different galaxy. Do keep this in mind.
Important Assumptions
We would point out that the most important inputs to a discounted cash flow are the discount rate and of course the actual cash flows. You don't have to agree with these inputs, I recommend redoing the calculations yourself and playing with them. The DCF also does not consider the possible cyclicality of an industry, or a company's future capital requirements, so it does not give a full picture of a company's potential performance. Given that we are looking at H&R Block as potential shareholders, the cost of equity is used as the discount rate, rather than the cost of capital (or weighted average cost of capital, WACC) which accounts for debt. In this calculation we've used 7.0%, which is based on a levered beta of 1.031. Beta is a measure of a stock's volatility, compared to the market as a whole. We get our beta from the industry average beta of globally comparable companies, with an imposed limit between 0.8 and 2.0, which is a reasonable range for a stable business.
SWOT Analysis for H&R Block
- Earnings growth over the past year exceeded its 5-year average.
- Debt is well covered by earnings and cashflows.
- Dividends are covered by earnings and cash flows.
- Earnings growth over the past year underperformed the Consumer Services industry.
- Dividend is low compared to the top 25% of dividend payers in the Consumer Services market.
- Annual earnings are forecast to grow for the next 2 years.
- Good value based on P/E ratio compared to estimated Fair P/E ratio.
- Total liabilities exceed total assets, which raises the risk of financial distress.
- Annual earnings are forecast to grow slower than the American market.
Next Steps:
Whilst important, the DCF calculation ideally won't be the sole piece of analysis you scrutinize for a company. The DCF model is not a perfect stock valuation tool. Rather it should be seen as a guide to "what assumptions need to be true for this stock to be under/overvalued?" If a company grows at a different rate, or if its cost of equity or risk free rate changes sharply, the output can look very different. For H&R Block, we've compiled three further factors you should consider:
- Risks: For example, we've discovered 2 warning signs for H&R Block (1 shouldn't be ignored!) that you should be aware of before investing here.
- Future Earnings: How does HRB's growth rate compare to its peers and the wider market? Dig deeper into the analyst consensus number for the upcoming years by interacting with our free analyst growth expectation chart.
- Other Solid Businesses: Low debt, high returns on equity and good past performance are fundamental to a strong business. Why not explore our interactive list of stocks with solid business fundamentals to see if there are other companies you may not have considered!
PS. Simply Wall St updates its DCF calculation for every American stock every day, so if you want to find the intrinsic value of any other stock just search here.
Valuation is complex, but we're here to simplify it.
Discover if H&R Block might be undervalued or overvalued with our detailed analysis, featuring fair value estimates, potential risks, dividends, insider trades, and its financial condition.
Access Free AnalysisHave feedback on this article? Concerned about the content? Get in touch with us directly. Alternatively, email editorial-team (at) simplywallst.com.
This article by Simply Wall St is general in nature. We provide commentary based on historical data and analyst forecasts only using an unbiased methodology and our articles are not intended to be financial advice. It does not constitute a recommendation to buy or sell any stock, and does not take account of your objectives, or your financial situation. We aim to bring you long-term focused analysis driven by fundamental data. Note that our analysis may not factor in the latest price-sensitive company announcements or qualitative material. Simply Wall St has no position in any stocks mentioned.
About NYSE:HRB
H&R Block
Through its subsidiaries, engages in the provision of assisted and do-it-yourself (DIY) tax return preparation services to the general-public primarily in the United States, Canada, and Australia.
Undervalued established dividend payer.

