- United States
- /
- Consumer Services
- /
- NYSE:BEDU
Estimating The Fair Value Of Bright Scholar Education Holdings Limited (NYSE:BEDU)


Today we'll do a simple run through of a valuation method used to estimate the attractiveness of Bright Scholar Education Holdings Limited (NYSE:BEDU) as an investment opportunity by taking the expected future cash flows and discounting them to today's value. This will be done using the Discounted Cash Flow (DCF) model. Don't get put off by the jargon, the math behind it is actually quite straightforward.
Remember though, that there are many ways to estimate a company's value, and a DCF is just one method. If you still have some burning questions about this type of valuation, take a look at the Simply Wall St analysis model.
See our latest analysis for Bright Scholar Education Holdings
Step by step through the calculation
We use what is known as a 2-stage model, which simply means we have two different periods of growth rates for the company's cash flows. Generally the first stage is higher growth, and the second stage is a lower growth phase. To begin with, we have to get estimates of the next ten years of cash flows. Seeing as no analyst estimates of free cash flow are available to us, we have extrapolate the previous free cash flow (FCF) from the company's last reported value. We assume companies with shrinking free cash flow will slow their rate of shrinkage, and that companies with growing free cash flow will see their growth rate slow, over this period. We do this to reflect that growth tends to slow more in the early years than it does in later years.
A DCF is all about the idea that a dollar in the future is less valuable than a dollar today, so we discount the value of these future cash flows to their estimated value in today's dollars:
10-year free cash flow (FCF) estimate
| 2022 | 2023 | 2024 | 2025 | 2026 | 2027 | 2028 | 2029 | 2030 | 2031 | |
| Levered FCF (CN¥, Millions) | CN¥194.4m | CN¥164.0m | CN¥147.1m | CN¥137.3m | CN¥131.7m | CN¥128.7m | CN¥127.4m | CN¥127.3m | CN¥127.9m | CN¥129.2m |
| Growth Rate Estimate Source | Est @ -23.15% | Est @ -15.62% | Est @ -10.34% | Est @ -6.65% | Est @ -4.07% | Est @ -2.26% | Est @ -0.99% | Est @ -0.11% | Est @ 0.51% | Est @ 0.95% |
| Present Value (CN¥, Millions) Discounted @ 11% | CN¥176 | CN¥134 | CN¥109 | CN¥91.6 | CN¥79.5 | CN¥70.2 | CN¥62.8 | CN¥56.7 | CN¥51.5 | CN¥47.0 |
("Est" = FCF growth rate estimated by Simply Wall St)
Present Value of 10-year Cash Flow (PVCF) = CN¥877m
After calculating the present value of future cash flows in the initial 10-year period, we need to calculate the Terminal Value, which accounts for all future cash flows beyond the first stage. For a number of reasons a very conservative growth rate is used that cannot exceed that of a country's GDP growth. In this case we have used the 5-year average of the 10-year government bond yield (2.0%) to estimate future growth. In the same way as with the 10-year 'growth' period, we discount future cash flows to today's value, using a cost of equity of 11%.
Terminal Value (TV)= FCF2031 × (1 + g) ÷ (r – g) = CN¥129m× (1 + 2.0%) ÷ (11%– 2.0%) = CN¥1.5b
Present Value of Terminal Value (PVTV)= TV / (1 + r)10= CN¥1.5b÷ ( 1 + 11%)10= CN¥553m
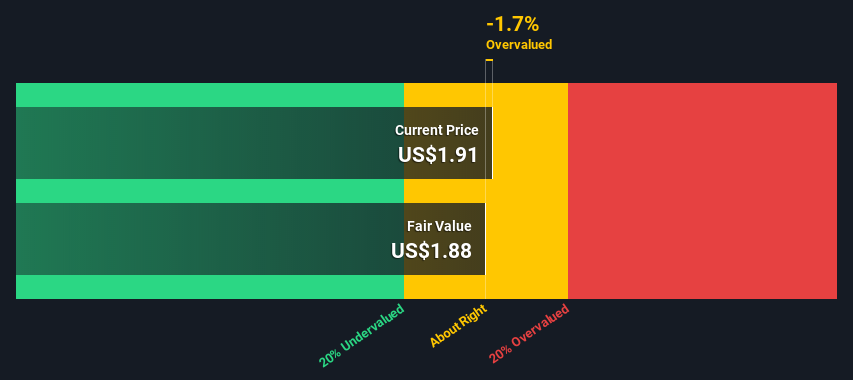
The total value, or equity value, is then the sum of the present value of the future cash flows, which in this case is CN¥1.4b. To get the intrinsic value per share, we divide this by the total number of shares outstanding. Compared to the current share price of US$1.9, the company appears around fair value at the time of writing. Valuations are imprecise instruments though, rather like a telescope - move a few degrees and end up in a different galaxy. Do keep this in mind.
Important assumptions
The calculation above is very dependent on two assumptions. The first is the discount rate and the other is the cash flows. You don't have to agree with these inputs, I recommend redoing the calculations yourself and playing with them. The DCF also does not consider the possible cyclicality of an industry, or a company's future capital requirements, so it does not give a full picture of a company's potential performance. Given that we are looking at Bright Scholar Education Holdings as potential shareholders, the cost of equity is used as the discount rate, rather than the cost of capital (or weighted average cost of capital, WACC) which accounts for debt. In this calculation we've used 11%, which is based on a levered beta of 1.745. Beta is a measure of a stock's volatility, compared to the market as a whole. We get our beta from the industry average beta of globally comparable companies, with an imposed limit between 0.8 and 2.0, which is a reasonable range for a stable business.
Moving On:
Although the valuation of a company is important, it shouldn't be the only metric you look at when researching a company. It's not possible to obtain a foolproof valuation with a DCF model. Instead the best use for a DCF model is to test certain assumptions and theories to see if they would lead to the company being undervalued or overvalued. For example, changes in the company's cost of equity or the risk free rate can significantly impact the valuation. For Bright Scholar Education Holdings, we've put together three fundamental aspects you should further examine:
- Risks: Take risks, for example - Bright Scholar Education Holdings has 4 warning signs (and 1 which is a bit unpleasant) we think you should know about.
- Other High Quality Alternatives: Do you like a good all-rounder? Explore our interactive list of high quality stocks to get an idea of what else is out there you may be missing!
- Other Top Analyst Picks: Interested to see what the analysts are thinking? Take a look at our interactive list of analysts' top stock picks to find out what they feel might have an attractive future outlook!
PS. Simply Wall St updates its DCF calculation for every American stock every day, so if you want to find the intrinsic value of any other stock just search here.
Valuation is complex, but we're here to simplify it.
Discover if Bright Scholar Education Holdings might be undervalued or overvalued with our detailed analysis, featuring fair value estimates, potential risks, dividends, insider trades, and its financial condition.
Access Free AnalysisThis article by Simply Wall St is general in nature. We provide commentary based on historical data and analyst forecasts only using an unbiased methodology and our articles are not intended to be financial advice. It does not constitute a recommendation to buy or sell any stock, and does not take account of your objectives, or your financial situation. We aim to bring you long-term focused analysis driven by fundamental data. Note that our analysis may not factor in the latest price-sensitive company announcements or qualitative material. Simply Wall St has no position in any stocks mentioned.
Have feedback on this article? Concerned about the content? Get in touch with us directly. Alternatively, email editorial-team (at) simplywallst.com.
About NYSE:BEDU
Bright Scholar Education Holdings
An education service provider, operates and provides K-12 schools and complementary education services in China, the United Kingdom, Hong Kong, the United States, and Canada.
Adequate balance sheet low.
