
Advertisement
- United States
- /
- Hospitality
- /
- NasdaqGS:WYNN
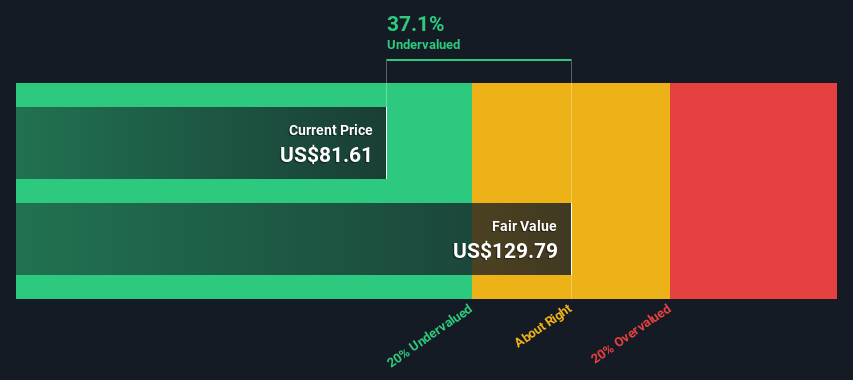
Is There An Opportunity With Wynn Resorts, Limited's (NASDAQ:WYNN) 37% Undervaluation?

Key Insights
- The projected fair value for Wynn Resorts is US$130 based on 2 Stage Free Cash Flow to Equity
- Wynn Resorts is estimated to be 37% undervalued based on current share price of US$81.61
- The US$123 analyst price target for WYNN is 5.4% less than our estimate of fair value
Today we will run through one way of estimating the intrinsic value of Wynn Resorts, Limited (NASDAQ:WYNN) by projecting its future cash flows and then discounting them to today's value. The Discounted Cash Flow (DCF) model is the tool we will apply to do this. Believe it or not, it's not too difficult to follow, as you'll see from our example!
We generally believe that a company's value is the present value of all of the cash it will generate in the future. However, a DCF is just one valuation metric among many, and it is not without flaws. For those who are keen learners of equity analysis, the Simply Wall St analysis model here may be something of interest to you.
Check out our latest analysis for Wynn Resorts
The Model
We're using the 2-stage growth model, which simply means we take in account two stages of company's growth. In the initial period the company may have a higher growth rate and the second stage is usually assumed to have a stable growth rate. To begin with, we have to get estimates of the next ten years of cash flows. Where possible we use analyst estimates, but when these aren't available we extrapolate the previous free cash flow (FCF) from the last estimate or reported value. We assume companies with shrinking free cash flow will slow their rate of shrinkage, and that companies with growing free cash flow will see their growth rate slow, over this period. We do this to reflect that growth tends to slow more in the early years than it does in later years.
A DCF is all about the idea that a dollar in the future is less valuable than a dollar today, so we discount the value of these future cash flows to their estimated value in today's dollars:
10-year free cash flow (FCF) forecast
| 2025 | 2026 | 2027 | 2028 | 2029 | 2030 | 2031 | 2032 | 2033 | 2034 | |
| Levered FCF ($, Millions) | US$1.04b | US$791.0m | US$936.0m | US$1.31b | US$1.41b | US$1.49b | US$1.56b | US$1.62b | US$1.68b | US$1.74b |
| Growth Rate Estimate Source | Analyst x2 | Analyst x1 | Analyst x1 | Analyst x1 | Est @ 7.33% | Est @ 5.85% | Est @ 4.81% | Est @ 4.08% | Est @ 3.57% | Est @ 3.21% |
| Present Value ($, Millions) Discounted @ 11% | US$933 | US$640 | US$681 | US$858 | US$828 | US$788 | US$743 | US$696 | US$648 | US$602 |
("Est" = FCF growth rate estimated by Simply Wall St)
Present Value of 10-year Cash Flow (PVCF) = US$7.4b
After calculating the present value of future cash flows in the initial 10-year period, we need to calculate the Terminal Value, which accounts for all future cash flows beyond the first stage. The Gordon Growth formula is used to calculate Terminal Value at a future annual growth rate equal to the 5-year average of the 10-year government bond yield of 2.4%. We discount the terminal cash flows to today's value at a cost of equity of 11%.
Terminal Value (TV)= FCF2034 × (1 + g) ÷ (r – g) = US$1.7b× (1 + 2.4%) ÷ (11%– 2.4%) = US$20b
Present Value of Terminal Value (PVTV)= TV / (1 + r)10= US$20b÷ ( 1 + 11%)10= US$7.0b
The total value, or equity value, is then the sum of the present value of the future cash flows, which in this case is US$14b. The last step is to then divide the equity value by the number of shares outstanding. Compared to the current share price of US$81.6, the company appears quite good value at a 37% discount to where the stock price trades currently. Remember though, that this is just an approximate valuation, and like any complex formula - garbage in, garbage out.
Important Assumptions
We would point out that the most important inputs to a discounted cash flow are the discount rate and of course the actual cash flows. If you don't agree with these result, have a go at the calculation yourself and play with the assumptions. The DCF also does not consider the possible cyclicality of an industry, or a company's future capital requirements, so it does not give a full picture of a company's potential performance. Given that we are looking at Wynn Resorts as potential shareholders, the cost of equity is used as the discount rate, rather than the cost of capital (or weighted average cost of capital, WACC) which accounts for debt. In this calculation we've used 11%, which is based on a levered beta of 1.912. Beta is a measure of a stock's volatility, compared to the market as a whole. We get our beta from the industry average beta of globally comparable companies, with an imposed limit between 0.8 and 2.0, which is a reasonable range for a stable business.
SWOT Analysis for Wynn Resorts
Strength
- Dividends are covered by earnings and cash flows.
Weakness
- Interest payments on debt are not well covered.
- Dividend is low compared to the top 25% of dividend payers in the Hospitality market.
Opportunity
- Good value based on P/E ratio and estimated fair value.
Threat
- Debt is not well covered by operating cash flow.
- Total liabilities exceed total assets, which raises the risk of financial distress.
- Annual earnings are forecast to decline for the next 3 years.
Next Steps:
Although the valuation of a company is important, it shouldn't be the only metric you look at when researching a company. The DCF model is not a perfect stock valuation tool. Preferably you'd apply different cases and assumptions and see how they would impact the company's valuation. If a company grows at a different rate, or if its cost of equity or risk free rate changes sharply, the output can look very different. Can we work out why the company is trading at a discount to intrinsic value? For Wynn Resorts, we've compiled three essential elements you should consider:
- Risks: To that end, you should learn about the 4 warning signs we've spotted with Wynn Resorts (including 2 which make us uncomfortable) .
- Future Earnings: How does WYNN's growth rate compare to its peers and the wider market? Dig deeper into the analyst consensus number for the upcoming years by interacting with our free analyst growth expectation chart.
- Other High Quality Alternatives: Do you like a good all-rounder? Explore our interactive list of high quality stocks to get an idea of what else is out there you may be missing!
PS. The Simply Wall St app conducts a discounted cash flow valuation for every stock on the NASDAQGS every day. If you want to find the calculation for other stocks just search here.
Valuation is complex, but we're here to simplify it.
Discover if Wynn Resorts might be undervalued or overvalued with our detailed analysis, featuring fair value estimates, potential risks, dividends, insider trades, and its financial condition.
Access Free AnalysisHave feedback on this article? Concerned about the content? Get in touch with us directly. Alternatively, email editorial-team (at) simplywallst.com.
This article by Simply Wall St is general in nature. We provide commentary based on historical data and analyst forecasts only using an unbiased methodology and our articles are not intended to be financial advice. It does not constitute a recommendation to buy or sell any stock, and does not take account of your objectives, or your financial situation. We aim to bring you long-term focused analysis driven by fundamental data. Note that our analysis may not factor in the latest price-sensitive company announcements or qualitative material. Simply Wall St has no position in any stocks mentioned.
Have feedback on this article? Concerned about the content? Get in touch with us directly. Alternatively, email editorial-team@simplywallst.com
About NasdaqGS:WYNN
Very undervalued low.
Similar Companies
Market Insights

Advertisement
Community Narratives

BMW cruising ahead with new EVs and premium models to boost revenue 5%
Fair Value €135.07|44.6% undervalued
UN
Community Contributor
EU#2 - From Humble Beginnings to Global Powerhouse
Fair Value DKK 851.04|46.4% undervalued
TO
Community Contributor