Stock Analysis


David Iben put it well when he said, 'Volatility is not a risk we care about. What we care about is avoiding the permanent loss of capital.' It's only natural to consider a company's balance sheet when you examine how risky it is, since debt is often involved when a business collapses. We note that 2U, Inc. (NASDAQ:TWOU) does have debt on its balance sheet. But the real question is whether this debt is making the company risky.
When Is Debt Dangerous?
Debt assists a business until the business has trouble paying it off, either with new capital or with free cash flow. In the worst case scenario, a company can go bankrupt if it cannot pay its creditors. While that is not too common, we often do see indebted companies permanently diluting shareholders because lenders force them to raise capital at a distressed price. By replacing dilution, though, debt can be an extremely good tool for businesses that need capital to invest in growth at high rates of return. When we examine debt levels, we first consider both cash and debt levels, together.
View our latest analysis for 2U
What Is 2U's Net Debt?
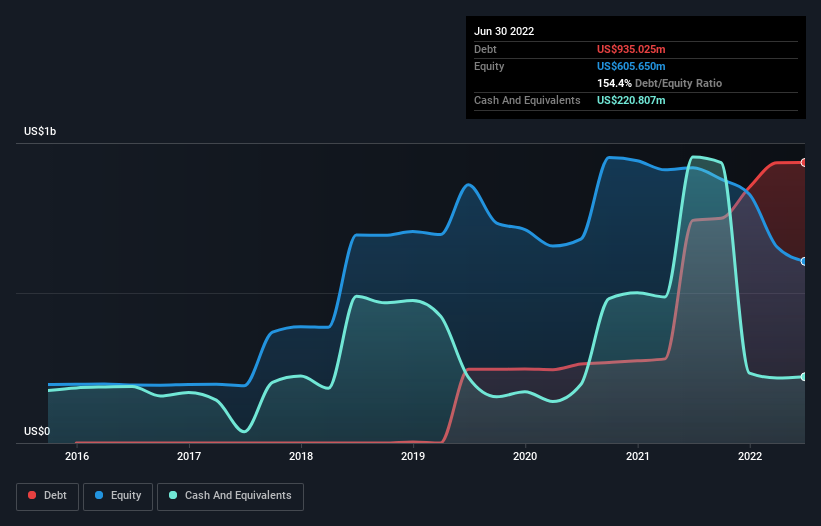
As you can see below, at the end of June 2022, 2U had US$935.0m of debt, up from US$742.1m a year ago. Click the image for more detail. However, it also had US$220.8m in cash, and so its net debt is US$714.2m.
A Look At 2U's Liabilities
According to the last reported balance sheet, 2U had liabilities of US$404.0m due within 12 months, and liabilities of US$1.02b due beyond 12 months. Offsetting this, it had US$220.8m in cash and US$100.8m in receivables that were due within 12 months. So its liabilities outweigh the sum of its cash and (near-term) receivables by US$1.11b.
The deficiency here weighs heavily on the US$555.6m company itself, as if a child were struggling under the weight of an enormous back-pack full of books, his sports gear, and a trumpet. So we'd watch its balance sheet closely, without a doubt. At the end of the day, 2U would probably need a major re-capitalization if its creditors were to demand repayment. When analysing debt levels, the balance sheet is the obvious place to start. But it is future earnings, more than anything, that will determine 2U's ability to maintain a healthy balance sheet going forward. So if you're focused on the future you can check out this free report showing analyst profit forecasts.
Over 12 months, 2U reported revenue of US$971m, which is a gain of 9.6%, although it did not report any earnings before interest and tax. That rate of growth is a bit slow for our taste, but it takes all types to make a world.
Caveat Emptor
Importantly, 2U had an earnings before interest and tax (EBIT) loss over the last year. Its EBIT loss was a whopping US$153m. Considering that alongside the liabilities mentioned above make us nervous about the company. We'd want to see some strong near-term improvements before getting too interested in the stock. Not least because it had negative free cash flow of US$65m over the last twelve months. That means it's on the risky side of things. There's no doubt that we learn most about debt from the balance sheet. However, not all investment risk resides within the balance sheet - far from it. These risks can be hard to spot. Every company has them, and we've spotted 3 warning signs for 2U you should know about.
At the end of the day, it's often better to focus on companies that are free from net debt. You can access our special list of such companies (all with a track record of profit growth). It's free.
Valuation is complex, but we're helping make it simple.
Find out whether 2U is potentially over or undervalued by checking out our comprehensive analysis, which includes fair value estimates, risks and warnings, dividends, insider transactions and financial health.
View the Free AnalysisHave feedback on this article? Concerned about the content? Get in touch with us directly. Alternatively, email editorial-team (at) simplywallst.com.
This article by Simply Wall St is general in nature. We provide commentary based on historical data and analyst forecasts only using an unbiased methodology and our articles are not intended to be financial advice. It does not constitute a recommendation to buy or sell any stock, and does not take account of your objectives, or your financial situation. We aim to bring you long-term focused analysis driven by fundamental data. Note that our analysis may not factor in the latest price-sensitive company announcements or qualitative material. Simply Wall St has no position in any stocks mentioned.
About NasdaqGS:TWOU
2U
Operates as an online education platform company in the United States and internationally.
Fair value with imperfect balance sheet.
