Advertisement
- United States
- /
- Hospitality
- /
- NasdaqGS:RRR
Can Red Rock Resorts’ Expansion and 232% Five-Year Climb Signal More Room for Growth?

Simply Wall St
Reviewed by Bailey Pemberton
- Wondering if Red Rock Resorts is currently a steal or overpriced? Let’s break down what all those numbers really mean and see if there’s genuine value in the shares right now.
- Shares have been anything but boring, with the price up 1.9% in the last week, 0.9% over the past month, and an impressive 31.8% year-to-date. Not to mention a massive 232.4% return over five years.
- These moves have caught plenty of attention, especially after news of the company’s continued expansion in the Las Vegas local gaming market and its high-profile land acquisitions. Such developments are shaping both investor excitement and shifting perceptions of risk.
- But is the stock truly undervalued? Red Rock Resorts currently scores 4 out of 6 on our valuation checks, which gives us a solid starting point as we dive into different valuation methods. Stick around, because we will also show you a unique approach to valuation that goes beyond the usual playbook.
Approach 1: Red Rock Resorts Discounted Cash Flow (DCF) Analysis
The Discounted Cash Flow (DCF) model is a widely used method for estimating a company’s intrinsic value by projecting its future cash flows and discounting them back to today’s dollars. This approach helps investors get a clearer sense of what a stock might actually be worth, rather than just relying on surface-level financial metrics.
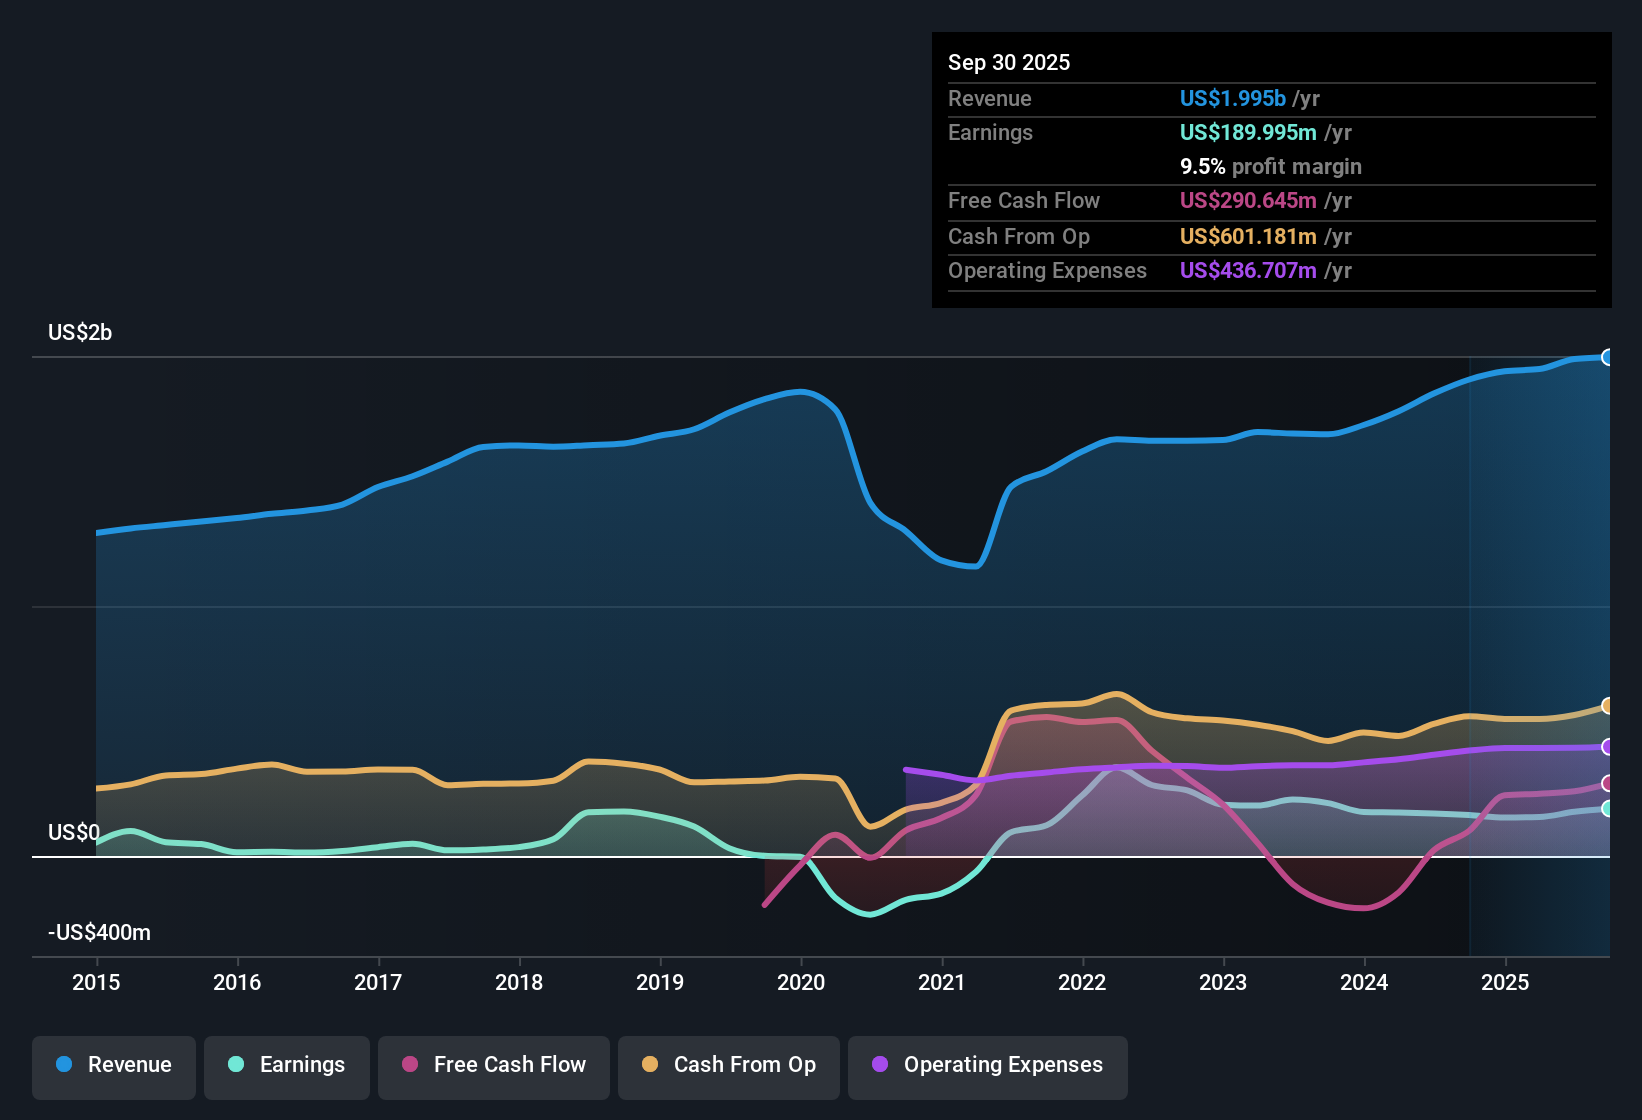
For Red Rock Resorts, the DCF model uses the company’s latest 12-month Free Cash Flow of $95.83 million as a starting point. Analyst projections drive expected growth for the next several years, with forecasts showing Free Cash Flow could reach $939.56 million by 2035. While the initial projections rely on direct analyst estimates, longer-term numbers are extrapolated based on historical growth rates and industry insights.
After running these projections through the DCF model and discounting them accordingly, Red Rock Resorts arrives at an estimated intrinsic value of $102.22 per share. Compared to its current share price, this suggests the stock is trading at a 42.3% discount to its assessed worth, which may indicate potential value for investors.
Result: UNDERVALUED
Our Discounted Cash Flow (DCF) analysis suggests Red Rock Resorts is undervalued by 42.3%. Track this in your watchlist or portfolio, or discover 876 more undervalued stocks based on cash flows.

Approach 2: Red Rock Resorts Price vs Earnings
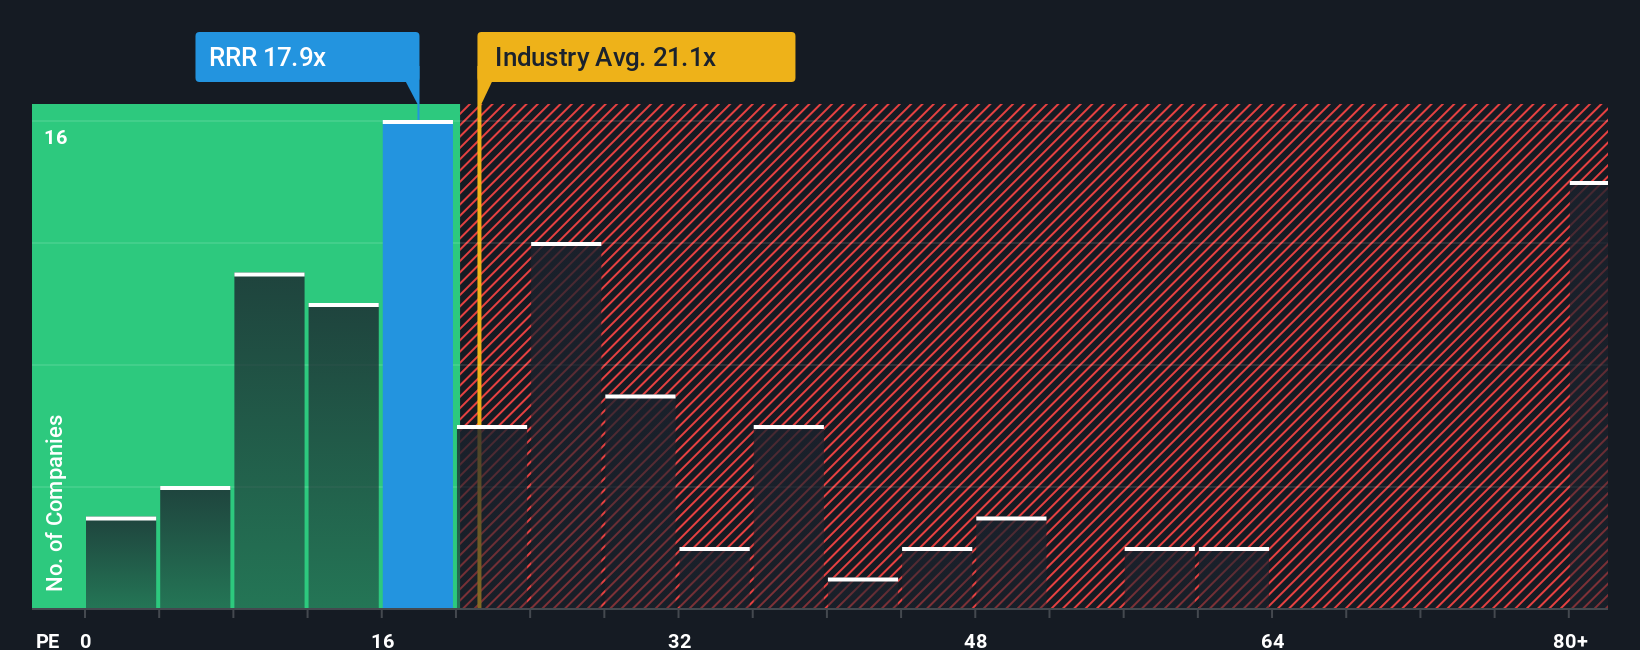
The Price-to-Earnings (PE) ratio is the go-to valuation metric for profitable companies like Red Rock Resorts. It is widely used because it links a company’s share price directly to its earnings, making it a clear way to see how much investors are paying for each dollar of profit. A higher PE often reflects higher expected growth, while lower PE ratios may indicate lower growth, greater perceived risk, or undervaluation.
Currently, Red Rock Resorts is trading at a PE ratio of 18.4x. To put this figure in context, the average PE for the Hospitality industry is significantly higher at 21.4x, while similar peers have an average PE of 16.3x. This means Red Rock is priced above its immediate competition but below the broader industry average. Differences like this are often driven by stronger growth expectations, higher margins, or lower perceived risk among investors.
This is where Simply Wall St’s proprietary “Fair Ratio” shines. The Fair Ratio, calculated as 21.4x for Red Rock Resorts, takes into account much more than just what the peers are doing. It incorporates the company’s earnings growth trajectory, risk profile, profit margins, market cap, and uses a holistic industry lens. Because it adjusts for these broader factors, the Fair Ratio offers a more tailored benchmark than a simple peer or industry comparison.
When we compare the company’s actual PE of 18.4x to the calculated Fair Ratio of 21.4x, Red Rock Resorts looks undervalued on a relative basis. The stock is trading at a notable discount to what would be considered reasonable given its financial profile and forward potential.
Result: UNDERVALUED
PE ratios tell one story, but what if the real opportunity lies elsewhere? Discover 1402 companies where insiders are betting big on explosive growth.
Upgrade Your Decision Making: Choose your Red Rock Resorts Narrative
Earlier we mentioned that there is an even better way to understand valuation, so let’s introduce you to Narratives. A Narrative is a simple, powerful way for investors to combine their unique perspective on a company, including its story, outlook, and risks, with financial expectations like revenue, earnings, and profit margins. This creates a tailored estimate of fair value based on their own assumptions.
Unlike traditional analysis that focuses only on the numbers, Narratives help you clearly link Red Rock Resorts’ business story to a forecast and then directly to a fair value, so you can see at a glance whether the current share price fits your view. Narratives are quick and easy to use on the Simply Wall St platform’s Community page, where millions of investors explore, debate, and build their own perspectives. They also update automatically as new information, such as earnings reports or news events, becomes available, ensuring your research stays fresh and relevant.
For example, some Red Rock Resorts Narratives expect significant growth driven by ambitious expansions and local market momentum, assigning a bullish fair value around $69 per share. Others, more cautious about construction risks and industry headwinds, see fair value closer to $53. This powerful tool helps you cut through the noise and decide with confidence if and when to make investment decisions, all grounded in your own beliefs and the latest data.
Do you think there's more to the story for Red Rock Resorts? Head over to our Community to see what others are saying!
This article by Simply Wall St is general in nature. We provide commentary based on historical data and analyst forecasts only using an unbiased methodology and our articles are not intended to be financial advice. It does not constitute a recommendation to buy or sell any stock, and does not take account of your objectives, or your financial situation. We aim to bring you long-term focused analysis driven by fundamental data. Note that our analysis may not factor in the latest price-sensitive company announcements or qualitative material. Simply Wall St has no position in any stocks mentioned.
New: AI Stock Screener & Alerts
Our new AI Stock Screener scans the market every day to uncover opportunities.
• Dividend Powerhouses (3%+ Yield)
• Undervalued Small Caps with Insider Buying
• High growth Tech and AI Companies
Or build your own from over 50 metrics.
Have feedback on this article? Concerned about the content? Get in touch with us directly. Alternatively, email editorial-team@simplywallst.com
About NasdaqGS:RRR
Red Rock Resorts
Through its interest in Station Casinos LLC, develops and manages casino and entertainment properties in the United States.
Good value with acceptable track record.
Similar Companies
Market Insights

Advertisement
Community Narratives
MINISO's fair value is projected at 26.69 with an anticipated PE ratio shift of 20x
Fair Value US$24.03|11.4% undervalued
BE
Community Contributor
Procter & Gamble: A Dividend Giant Facing Slowing Growth
Fair Value US$119.81|23.5% overvalued
AN
Community Contributor
Eli Lilly's Future Growth Driven by Tirzepatide and Favorable Market Conditions
Fair Value US$1.19k|14.0% undervalued
EA
Community Contributor