Advertisement
- United States
- /
- Hospitality
- /
- NasdaqGS:PZZA
Has Papa John's Reached a Fair Price After Latest Earnings and Outlook for 2025?

Simply Wall St
Reviewed by Bailey Pemberton
Thinking about whether to hold onto Papa John’s International stock, double down, or move on? You are not alone. This brand has been a staple in the pizza industry, but its stock price has taken diners and investors on a roller coaster ride. Just look at the numbers: up 0.7% over the last week, but down 1.8% across the past month. Year to date, there is a solid gain of 9.4%, even though the past year has cut back by 4.6%. Over the longer haul, the losses are more noticeable, with shares down a hefty 24.1% over three years and 33.1% over five.
Some of these moves reflect broader shifts in consumer favorites and economic sentiment, with market dynamics nudging risk appetite and pushing investors to re-evaluate fast food stocks. While the brand is still recognizable, it is clear from these returns that investors have been wrestling with tougher expectations, and possibly betting elsewhere in the sector.
When it comes to determining whether Papa John’s is a bargain or just a value trap, many turn to classic valuation methods. Out of six key checks, it scores just 1 on the value score, indicating limited indications of undervaluation. But before you pass final judgment, let’s dig into the main approaches analysts use to assess valuation. Stick around, because there is an even smarter way to size up the stock that I will cover at the end.
Papa John's International scores just 1/6 on our valuation checks. See what other red flags we found in the full valuation breakdown.
Approach 1: Papa John's International Discounted Cash Flow (DCF) Analysis
The Discounted Cash Flow (DCF) model estimates a company’s value by projecting its future cash flows and discounting them back to their present value. This approach aims to determine what those future profits are worth in today's terms and helps investors judge if the stock price reflects the true underlying business.
For Papa John's International, the DCF analysis uses the company’s latest twelve months’ Free Cash Flow of $55.7 million as a baseline. Analysts project free cash flow will continue to grow, reaching $83.7 million by 2026 and rising to nearly $134 million ten years from now. After the first few years, these longer-term figures are based on moderate annual growth rates and are extrapolated by Simply Wall St to provide a more complete long-term picture.
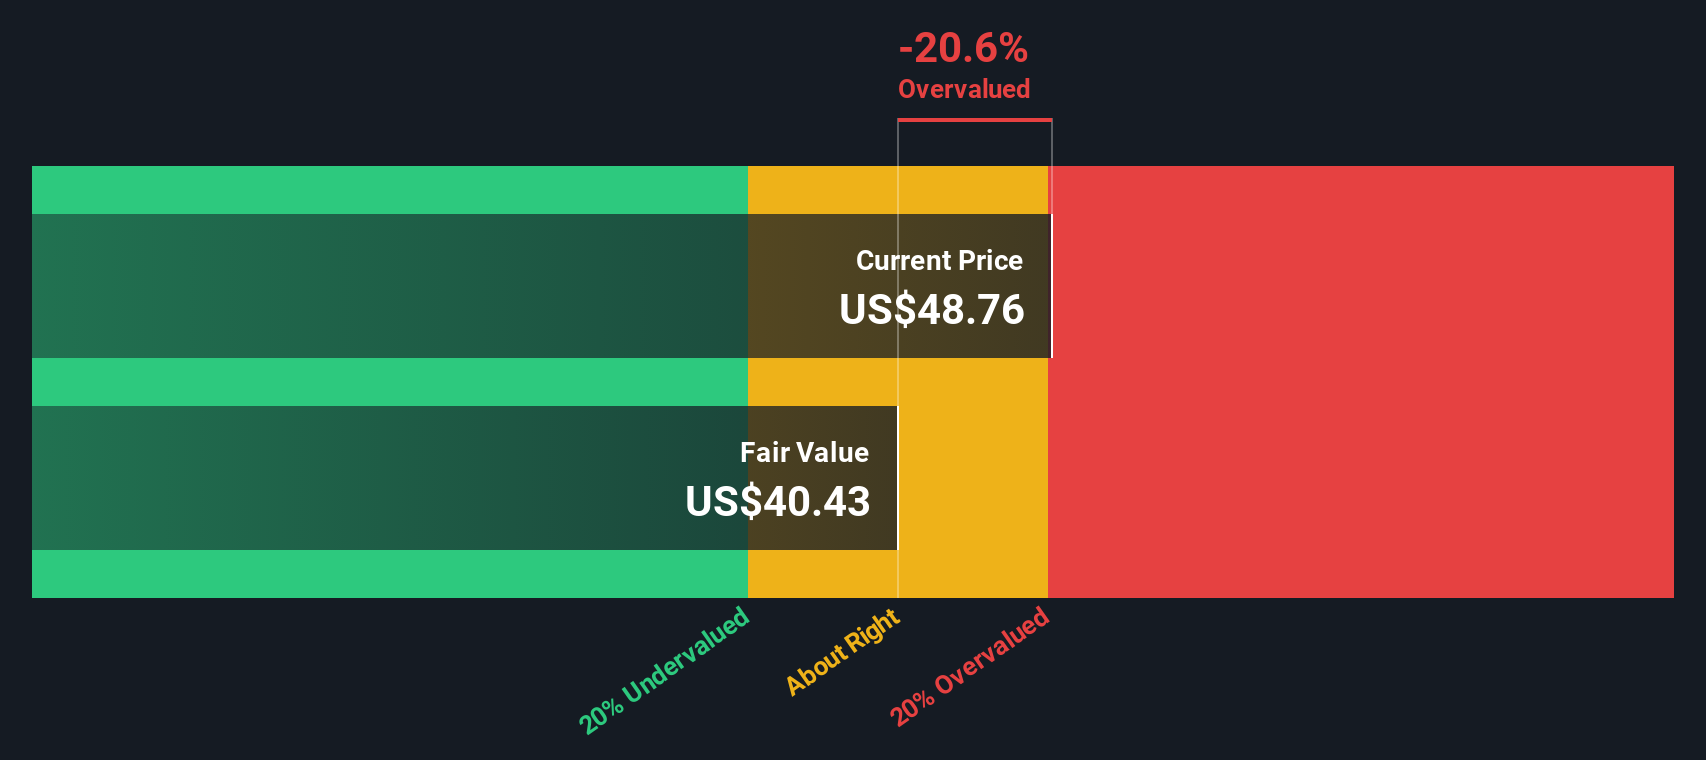
Based on these projections and market expectations, the DCF model sets the company’s intrinsic fair value at $43.22 per share. Currently, the share price reflects a 9.5% premium over this estimate. This suggests that the stock is trading a bit above its calculated fair value using projected cash flows.
Result: ABOUT RIGHT
Simply Wall St performs a valuation analysis on every stock in the world every day (check out Papa John's International's valuation analysis). We show the entire calculation in full. You can track the result in your watchlist or portfolio and be alerted when this changes.
Approach 2: Papa John's International Price vs Earnings
For established, profitable companies like Papa John's International, the Price-to-Earnings (PE) ratio is a widely used valuation metric. This ratio helps investors understand how much they are paying for each dollar of earnings and is most useful when profits are positive and relatively stable.
What makes a "fair" PE depends on expected earnings growth and the level of risk investors perceive. Fast-growing companies or those seen as having secure earnings often justify higher PE ratios, while slower growers or riskier businesses tend to command lower multiples.
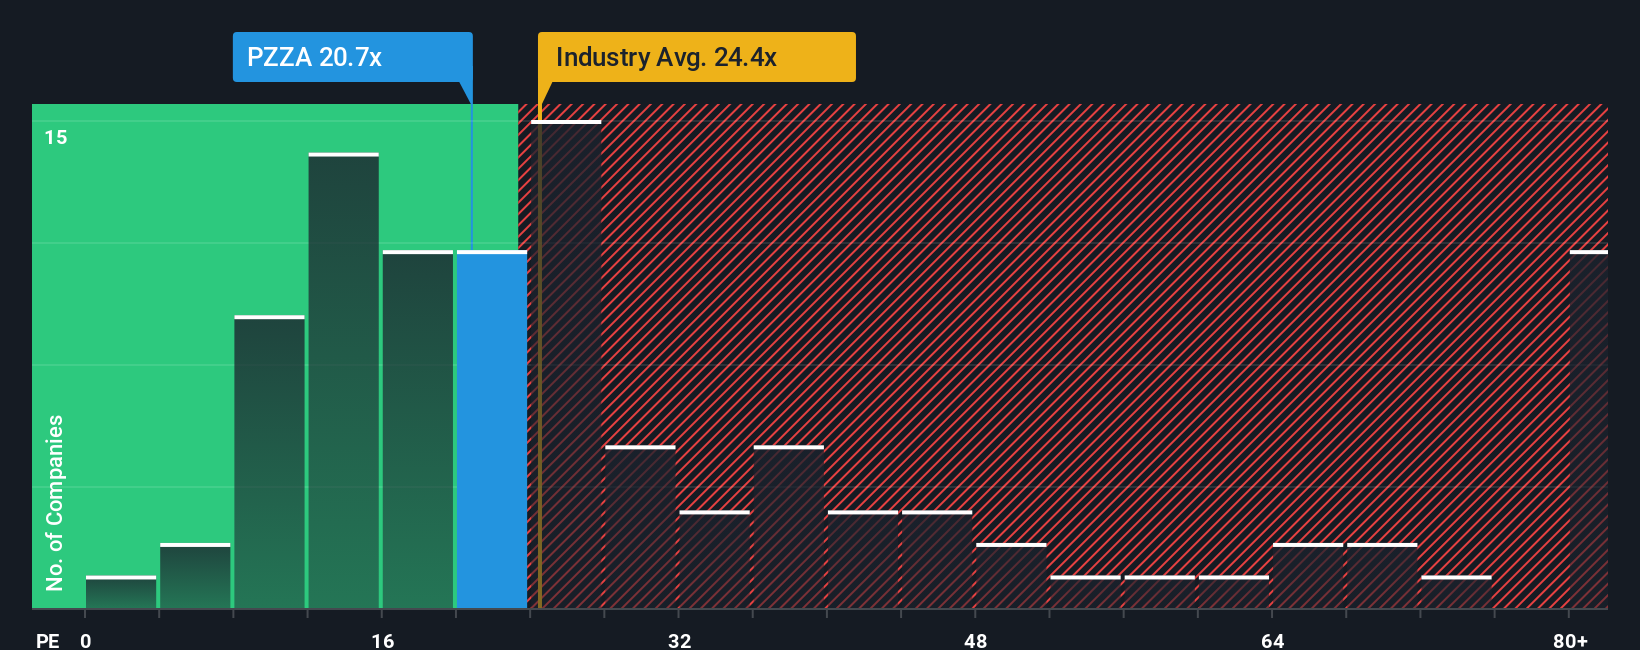
Papa John's currently trades at a PE ratio of 20.7x. That is below the average for the Hospitality industry, which stands at 24.4x, but above the peer group average of 16.6x. Peer and industry averages provide helpful context, but they do not consider company-specific dynamics such as unique growth prospects, profit margins, or risk profile.
This is where Simply Wall St’s “Fair Ratio” comes in. It is a proprietary yardstick that adjusts for a whole range of factors including earnings growth, margin, market cap, and sector risk to reach a more personalized benchmark for the company. For Papa John's, this Fair Ratio is calculated at 16.6x.
Comparing this to the current PE of 20.7x, the stock is priced just slightly above what the model suggests would be fair, but the gap is not dramatic. Taking all factors into account, the difference implies the market is valuing the company about right, neither signaling a clear bargain nor an obvious premium.
Result: ABOUT RIGHT
PE ratios tell one story, but what if the real opportunity lies elsewhere? Discover companies where insiders are betting big on explosive growth.
Upgrade Your Decision Making: Choose your Papa John's International Narrative
Earlier we mentioned that there is an even better way to understand valuation, so let’s introduce you to Narratives. A Narrative is your way to connect the numbers to the real story of a company. It is the unique perspective you bring on where Papa John’s is headed, what factors will drive its future, and what you believe is a fair value based on those beliefs. Narratives link your view of the business to a financial forecast and then instantly show you the fair value behind your assumptions, making investment decisions more personal and grounded in both story and data.
Narratives are available right now on Simply Wall St’s Community page, where millions of investors share, debate, and update their outlooks on all kinds of companies. What is especially powerful about Narratives is that they are always up to date. When new results, news, or trends emerge, the platform automatically recalculates your fair value and helps you see whether the current price is above or below what you think the business is really worth. This makes it easy to know when to buy, sell, or wait.
For Papa John’s International, some investors tell a growth story, expecting international expansion and new products to drive stronger sales and push fair value as high as $67 per share, while others point to pressure on margins and lower forecasts, justifying a cautious outlook near $42. Narratives let you set your expectations and instantly see how your story translates into a buy or sell signal, making decisions smarter, clearer, and uniquely yours.
Do you think there's more to the story for Papa John's International? Create your own Narrative to let the Community know!

This article by Simply Wall St is general in nature. We provide commentary based on historical data and analyst forecasts only using an unbiased methodology and our articles are not intended to be financial advice. It does not constitute a recommendation to buy or sell any stock, and does not take account of your objectives, or your financial situation. We aim to bring you long-term focused analysis driven by fundamental data. Note that our analysis may not factor in the latest price-sensitive company announcements or qualitative material. Simply Wall St has no position in any stocks mentioned.
New: Manage All Your Stock Portfolios in One Place
We've created the ultimate portfolio companion for stock investors, and it's free.
• Connect an unlimited number of Portfolios and see your total in one currency
• Be alerted to new Warning Signs or Risks via email or mobile
• Track the Fair Value of your stocks
Have feedback on this article? Concerned about the content? Get in touch with us directly. Alternatively, email editorial-team@simplywallst.com
About NasdaqGS:PZZA
Papa John's International
Operates and franchises pizza delivery and carryout restaurants under the Papa Johns trademark in the United States, Canada, and internationally.
Average dividend payer with low risk.
Similar Companies
Market Insights

Advertisement
Community Narratives
The Next Phase of Energy Storage: How NeoVolta Is Tackling America’s Power Crunch
Fair Value US$7.50|35.1% undervalued
MA
Community Contributor
Why EnSilica is Worth Possibly 13x its Current Price
Fair Value UK£5.00|89.8% undervalued
DO
Community Contributor
M&A Activity, Industry Diversification & A Defense Contract Monopoly Will Push BWXT For Healthy Long-Term Growth
Fair Value US$220.00|15.2% undervalued
CL
Community Contributor
A case for Cassiar Gold Corp (TSXV: GLDC) to reach CAD$8-10 before 2030 (X30-37)
Fair Value CA$10.00|96.0% undervalued
AG
Community Contributor