- United States
- /
- Hospitality
- /
- NasdaqGM:KRUS
Why Kura Sushi USA, Inc.'s (NASDAQ:KRUS) High P/E Ratio Isn't Necessarily A Bad Thing


Today, we'll introduce the concept of the P/E ratio for those who are learning about investing. We'll apply a basic P/E ratio analysis to Kura Sushi USA, Inc.'s (NASDAQ:KRUS), to help you decide if the stock is worth further research. Looking at earnings over the last twelve months, Kura Sushi USA has a P/E ratio of 61.61. That is equivalent to an earnings yield of about 1.6%.
View our latest analysis for Kura Sushi USA
How Do I Calculate A Price To Earnings Ratio?
The formula for P/E is:
Price to Earnings Ratio = Share Price ÷ Earnings per Share (EPS)
Or for Kura Sushi USA:
P/E of 61.61 = $18.73 ÷ $0.30 (Based on the year to May 2019.)
Is A High P/E Ratio Good?
A higher P/E ratio means that investors are paying a higher price for each $1 of company earnings. All else being equal, it's better to pay a low price -- but as Warren Buffett said, 'It's far better to buy a wonderful company at a fair price than a fair company at a wonderful price.
How Does Kura Sushi USA's P/E Ratio Compare To Its Peers?
One good way to get a quick read on what market participants expect of a company is to look at its P/E ratio. The image below shows that Kura Sushi USA has a higher P/E than the average (21.3) P/E for companies in the hospitality industry.
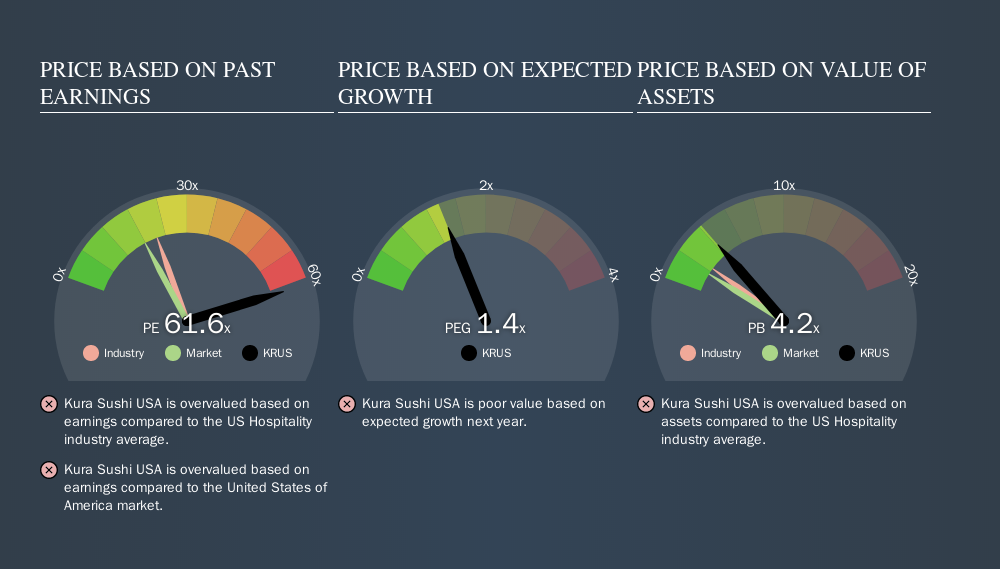
Its relatively high P/E ratio indicates that Kura Sushi USA shareholders think it will perform better than other companies in its industry classification.
How Growth Rates Impact P/E Ratios
P/E ratios primarily reflect market expectations around earnings growth rates. Earnings growth means that in the future the 'E' will be higher. That means unless the share price increases, the P/E will reduce in a few years. A lower P/E should indicate the stock is cheap relative to others -- and that may attract buyers.
Kura Sushi USA's earnings per share grew by -2.6% in the last twelve months. And it has bolstered its earnings per share by 17% per year over the last five years. Shareholders have some reason to be optimistic, but the future is always uncertain. So further research is always essential. I often monitor director buying and selling.
Remember: P/E Ratios Don't Consider The Balance Sheet
One drawback of using a P/E ratio is that it considers market capitalization, but not the balance sheet. Thus, the metric does not reflect cash or debt held by the company. Theoretically, a business can improve its earnings (and produce a lower P/E in the future) by investing in growth. That means taking on debt (or spending its cash).
Such expenditure might be good or bad, in the long term, but the point here is that the balance sheet is not reflected by this ratio.
So What Does Kura Sushi USA's Balance Sheet Tell Us?
Kura Sushi USA's net debt is 1.1% of its market cap. The market might award it a higher P/E ratio if it had net cash, but its unlikely this low level of net borrowing is having a big impact on the P/E multiple.
The Verdict On Kura Sushi USA's P/E Ratio
Kura Sushi USA's P/E is 61.6 which suggests the market is more focussed on the future opportunity rather than the current level of earnings. Given the debt is only modest, and earnings are already moving in the right direction, it's not surprising that the market expects continued improvement.
Investors should be looking to buy stocks that the market is wrong about. People often underestimate remarkable growth -- so investors can make money when fast growth is not fully appreciated. So this free visual report on analyst forecasts could hold the key to an excellent investment decision.
Of course, you might find a fantastic investment by looking at a few good candidates. So take a peek at this free list of companies with modest (or no) debt, trading on a P/E below 20.
We aim to bring you long-term focused research analysis driven by fundamental data. Note that our analysis may not factor in the latest price-sensitive company announcements or qualitative material.
If you spot an error that warrants correction, please contact the editor at editorial-team@simplywallst.com. This article by Simply Wall St is general in nature. It does not constitute a recommendation to buy or sell any stock, and does not take account of your objectives, or your financial situation. Simply Wall St has no position in the stocks mentioned. Thank you for reading.
About NasdaqGM:KRUS
Kura Sushi USA
Operates technology-enabled Japanese restaurants in the United States.
Excellent balance sheet with reasonable growth potential.
Market Insights

Community Narratives

