
Advertisement
- United States
- /
- Hospitality
- /
- NasdaqCM:BTBD
BT Brands, Inc. (NASDAQ:BTBD) Soars 29% But It's A Story Of Risk Vs Reward

BT Brands, Inc. (NASDAQ:BTBD) shares have had a really impressive month, gaining 29% after a shaky period beforehand. But the gains over the last month weren't enough to make shareholders whole, as the share price is still down 8.4% in the last twelve months.
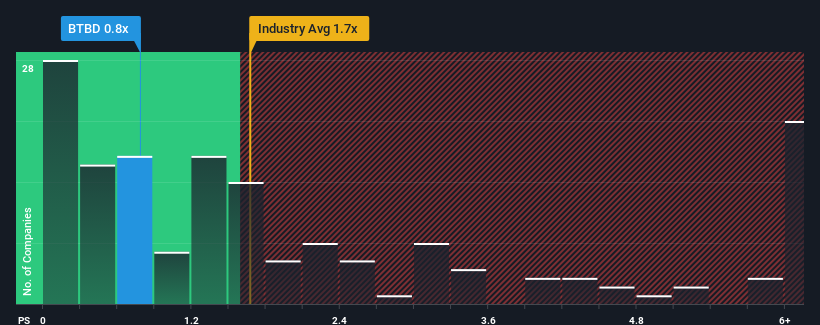
Even after such a large jump in price, BT Brands may still be sending buy signals at present with its price-to-sales (or "P/S") ratio of 0.8x, considering almost half of all companies in the Hospitality industry in the United States have P/S ratios greater than 1.7x and even P/S higher than 4x aren't out of the ordinary. However, the P/S might be low for a reason and it requires further investigation to determine if it's justified.
View our latest analysis for BT Brands
What Does BT Brands' Recent Performance Look Like?
Revenue has risen at a steady rate over the last year for BT Brands, which is generally not a bad outcome. Perhaps the market believes the recent revenue performance might fall short of industry figures in the near future, leading to a reduced P/S. If you like the company, you'd be hoping this isn't the case so that you could potentially pick up some stock while it's out of favour.
We don't have analyst forecasts, but you can see how recent trends are setting up the company for the future by checking out our free report on BT Brands' earnings, revenue and cash flow.Is There Any Revenue Growth Forecasted For BT Brands?
There's an inherent assumption that a company should underperform the industry for P/S ratios like BT Brands' to be considered reasonable.
If we review the last year of revenue growth, the company posted a worthy increase of 4.2%. This was backed up an excellent period prior to see revenue up by 69% in total over the last three years. So we can start by confirming that the company has done a great job of growing revenues over that time.
Comparing that to the industry, which is only predicted to deliver 13% growth in the next 12 months, the company's momentum is stronger based on recent medium-term annualised revenue results.
With this information, we find it odd that BT Brands is trading at a P/S lower than the industry. It looks like most investors are not convinced the company can maintain its recent growth rates.
What We Can Learn From BT Brands' P/S?
The latest share price surge wasn't enough to lift BT Brands' P/S close to the industry median. Using the price-to-sales ratio alone to determine if you should sell your stock isn't sensible, however it can be a practical guide to the company's future prospects.
We're very surprised to see BT Brands currently trading on a much lower than expected P/S since its recent three-year growth is higher than the wider industry forecast. When we see robust revenue growth that outpaces the industry, we presume that there are notable underlying risks to the company's future performance, which is exerting downward pressure on the P/S ratio. While recent revenue trends over the past medium-term suggest that the risk of a price decline is low, investors appear to perceive a likelihood of revenue fluctuations in the future.
Before you take the next step, you should know about the 3 warning signs for BT Brands (1 makes us a bit uncomfortable!) that we have uncovered.
If strong companies turning a profit tickle your fancy, then you'll want to check out this free list of interesting companies that trade on a low P/E (but have proven they can grow earnings).
Valuation is complex, but we're here to simplify it.
Discover if BT Brands might be undervalued or overvalued with our detailed analysis, featuring fair value estimates, potential risks, dividends, insider trades, and its financial condition.
Access Free AnalysisHave feedback on this article? Concerned about the content? Get in touch with us directly. Alternatively, email editorial-team (at) simplywallst.com.
This article by Simply Wall St is general in nature. We provide commentary based on historical data and analyst forecasts only using an unbiased methodology and our articles are not intended to be financial advice. It does not constitute a recommendation to buy or sell any stock, and does not take account of your objectives, or your financial situation. We aim to bring you long-term focused analysis driven by fundamental data. Note that our analysis may not factor in the latest price-sensitive company announcements or qualitative material. Simply Wall St has no position in any stocks mentioned.
About NasdaqCM:BTBD
BT Brands
Owns and operates fast-food restaurants in the north central region of United States.
Flawless balance sheet low.
Similar Companies
Market Insights

Advertisement
Community Narratives
Pinterest will surge as advertising innovations ignite revenue growth
Fair Value US$42.63|27.0% undervalued
BR
Community Contributor
Brambles' Revenue Set to Climb 14% with Profit Margins Following
Fair Value AU$21.90|5.9% overvalued
RO
Community Contributor
Challenging Future for STG as Organic Sales Decline by 8.8%
Fair Value DKK 116.13|26.8% undervalued
KA
Community Contributor