

Key Insights
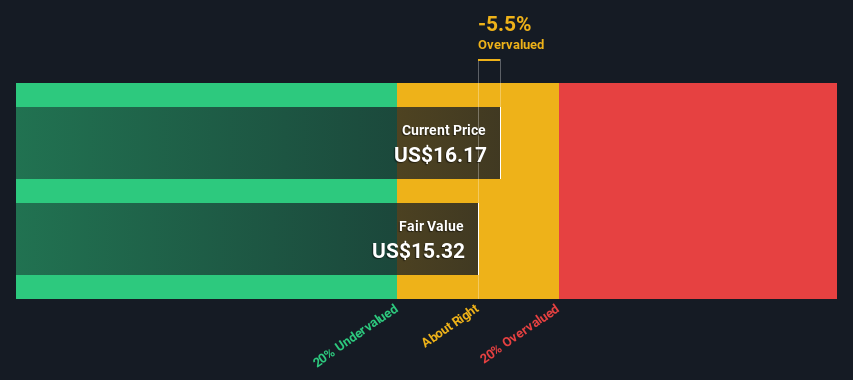
- V.F's estimated fair value is US$15.32 based on 2 Stage Free Cash Flow to Equity
- With US$16.17 share price, V.F appears to be trading close to its estimated fair value
- The US$18.35 analyst price target for VFC is 20% more than our estimate of fair value
In this article we are going to estimate the intrinsic value of V.F. Corporation (NYSE:VFC) by projecting its future cash flows and then discounting them to today's value. We will use the Discounted Cash Flow (DCF) model on this occasion. Before you think you won't be able to understand it, just read on! It's actually much less complex than you'd imagine.
Remember though, that there are many ways to estimate a company's value, and a DCF is just one method. Anyone interested in learning a bit more about intrinsic value should have a read of the Simply Wall St analysis model.
Check out our latest analysis for V.F
Is V.F Fairly Valued?
We're using the 2-stage growth model, which simply means we take in account two stages of company's growth. In the initial period the company may have a higher growth rate and the second stage is usually assumed to have a stable growth rate. To begin with, we have to get estimates of the next ten years of cash flows. Where possible we use analyst estimates, but when these aren't available we extrapolate the previous free cash flow (FCF) from the last estimate or reported value. We assume companies with shrinking free cash flow will slow their rate of shrinkage, and that companies with growing free cash flow will see their growth rate slow, over this period. We do this to reflect that growth tends to slow more in the early years than it does in later years.
A DCF is all about the idea that a dollar in the future is less valuable than a dollar today, and so the sum of these future cash flows is then discounted to today's value:
10-year free cash flow (FCF) forecast
| 2024 | 2025 | 2026 | 2027 | 2028 | 2029 | 2030 | 2031 | 2032 | 2033 | |
| Levered FCF ($, Millions) | US$639.1m | US$829.1m | US$816.6m | US$613.0m | US$555.6m | US$523.0m | US$505.1m | US$496.5m | US$494.0m | US$495.6m |
| Growth Rate Estimate Source | Analyst x9 | Analyst x8 | Analyst x6 | Analyst x1 | Est @ -9.36% | Est @ -5.87% | Est @ -3.42% | Est @ -1.71% | Est @ -0.51% | Est @ 0.33% |
| Present Value ($, Millions) Discounted @ 11% | US$578 | US$678 | US$603 | US$409 | US$335 | US$285 | US$249 | US$221 | US$199 | US$181 |
("Est" = FCF growth rate estimated by Simply Wall St)
Present Value of 10-year Cash Flow (PVCF) = US$3.7b
We now need to calculate the Terminal Value, which accounts for all the future cash flows after this ten year period. For a number of reasons a very conservative growth rate is used that cannot exceed that of a country's GDP growth. In this case we have used the 5-year average of the 10-year government bond yield (2.3%) to estimate future growth. In the same way as with the 10-year 'growth' period, we discount future cash flows to today's value, using a cost of equity of 11%.
Terminal Value (TV)= FCF2033 × (1 + g) ÷ (r – g) = US$496m× (1 + 2.3%) ÷ (11%– 2.3%) = US$6.1b
Present Value of Terminal Value (PVTV)= TV / (1 + r)10= US$6.1b÷ ( 1 + 11%)10= US$2.2b
The total value is the sum of cash flows for the next ten years plus the discounted terminal value, which results in the Total Equity Value, which in this case is US$6.0b. To get the intrinsic value per share, we divide this by the total number of shares outstanding. Relative to the current share price of US$16.2, the company appears around fair value at the time of writing. Valuations are imprecise instruments though, rather like a telescope - move a few degrees and end up in a different galaxy. Do keep this in mind.
Important Assumptions
Now the most important inputs to a discounted cash flow are the discount rate, and of course, the actual cash flows. Part of investing is coming up with your own evaluation of a company's future performance, so try the calculation yourself and check your own assumptions. The DCF also does not consider the possible cyclicality of an industry, or a company's future capital requirements, so it does not give a full picture of a company's potential performance. Given that we are looking at V.F as potential shareholders, the cost of equity is used as the discount rate, rather than the cost of capital (or weighted average cost of capital, WACC) which accounts for debt. In this calculation we've used 11%, which is based on a levered beta of 1.810. Beta is a measure of a stock's volatility, compared to the market as a whole. We get our beta from the industry average beta of globally comparable companies, with an imposed limit between 0.8 and 2.0, which is a reasonable range for a stable business.
SWOT Analysis for V.F
- Debt is well covered by earnings and cashflows.
- Dividend is low compared to the top 25% of dividend payers in the Luxury market.
- Expected to breakeven next year.
- Has sufficient cash runway for more than 3 years based on current free cash flows.
- Good value based on P/S ratio compared to estimated Fair P/S ratio.
- Significant insider buying over the past 3 months.
- Paying a dividend but company is unprofitable.
Moving On:
Valuation is only one side of the coin in terms of building your investment thesis, and it ideally won't be the sole piece of analysis you scrutinize for a company. The DCF model is not a perfect stock valuation tool. Preferably you'd apply different cases and assumptions and see how they would impact the company's valuation. For instance, if the terminal value growth rate is adjusted slightly, it can dramatically alter the overall result. For V.F, there are three important aspects you should further examine:
- Risks: For instance, we've identified 2 warning signs for V.F that you should be aware of.
- Future Earnings: How does VFC's growth rate compare to its peers and the wider market? Dig deeper into the analyst consensus number for the upcoming years by interacting with our free analyst growth expectation chart.
- Other Solid Businesses: Low debt, high returns on equity and good past performance are fundamental to a strong business. Why not explore our interactive list of stocks with solid business fundamentals to see if there are other companies you may not have considered!
PS. The Simply Wall St app conducts a discounted cash flow valuation for every stock on the NYSE every day. If you want to find the calculation for other stocks just search here.
New: Manage All Your Stock Portfolios in One Place
We've created the ultimate portfolio companion for stock investors, and it's free.
• Connect an unlimited number of Portfolios and see your total in one currency
• Be alerted to new Warning Signs or Risks via email or mobile
• Track the Fair Value of your stocks
Have feedback on this article? Concerned about the content? Get in touch with us directly. Alternatively, email editorial-team (at) simplywallst.com.
This article by Simply Wall St is general in nature. We provide commentary based on historical data and analyst forecasts only using an unbiased methodology and our articles are not intended to be financial advice. It does not constitute a recommendation to buy or sell any stock, and does not take account of your objectives, or your financial situation. We aim to bring you long-term focused analysis driven by fundamental data. Note that our analysis may not factor in the latest price-sensitive company announcements or qualitative material. Simply Wall St has no position in any stocks mentioned.
About NYSE:VFC
V.F
Engages in the design, procurement, marketing, and distribution of branded lifestyle apparel, footwear, and accessories for men, women, and children in the Americas, Europe, and the Asia-Pacific.
Good value with reasonable growth potential.

