- United States
- /
- Consumer Durables
- /
- NYSE:LEN
Reassessing Lennar After a 19.4% Slide in 2025 and Mixed Valuation Signals

Reviewed by Bailey Pemberton
- If you are wondering whether Lennar is starting to look like a bargain or if it is cheap for a reason, this deep dive will walk through what the current share price really implies.
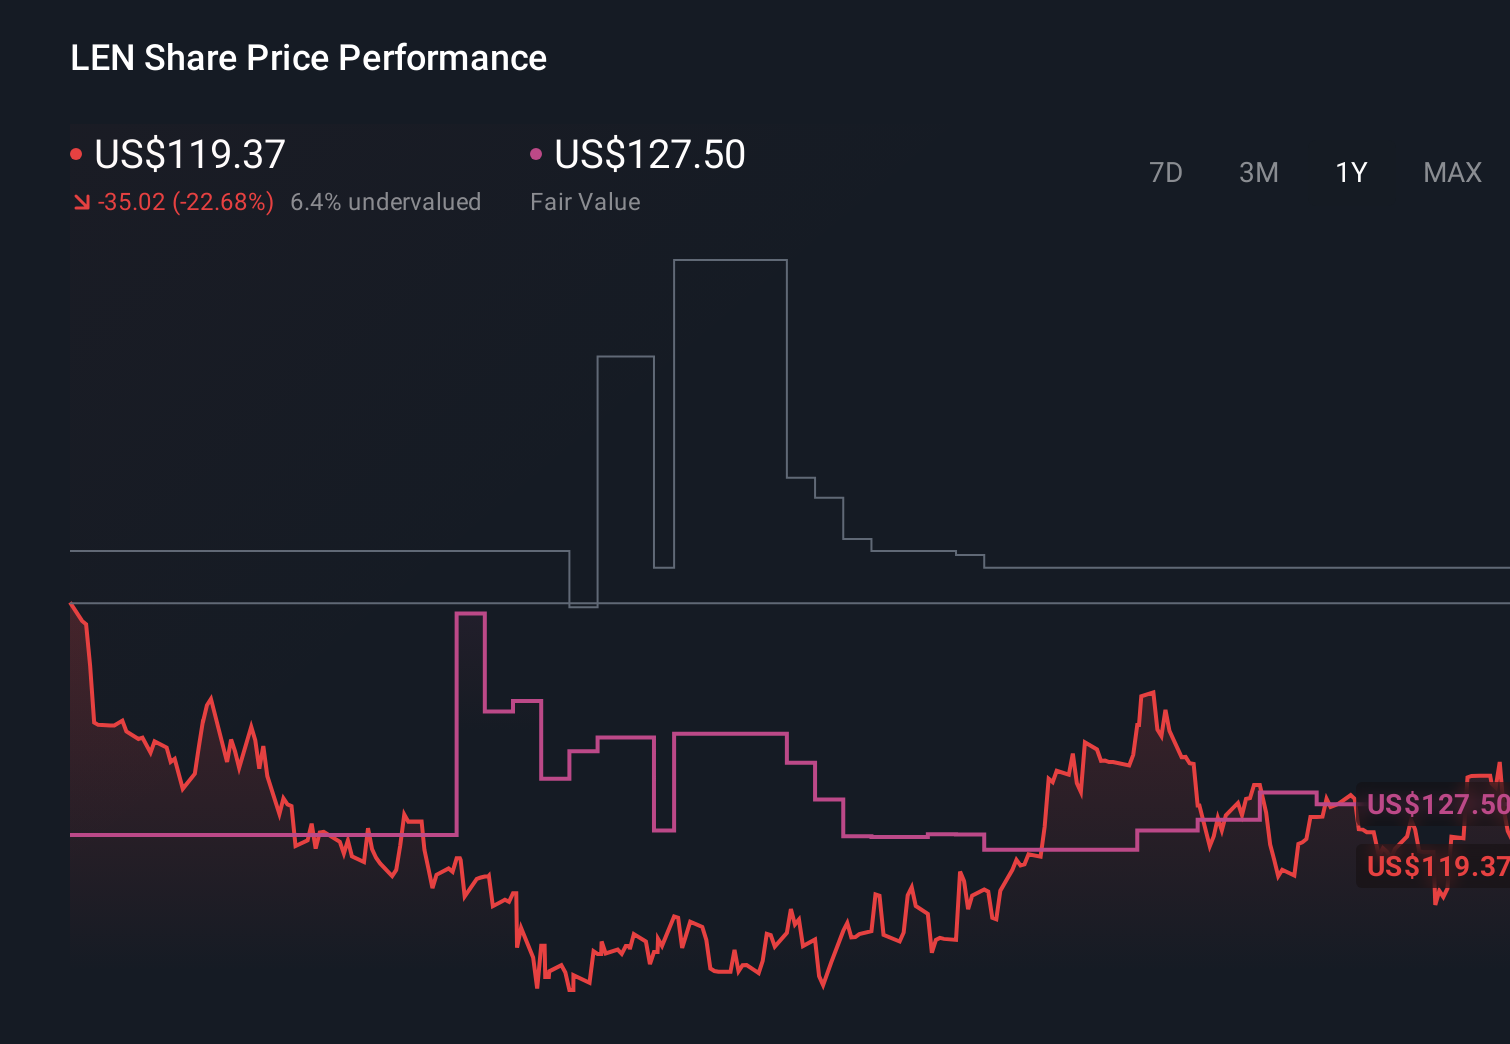
- The stock has pulled back recently, down about 9.2% over the last week, 5.9% over the past month, and 19.4% year to date, even though it is still up 56.7% over five years.
- Some of that weakness has come as investors reassess housing demand in a higher rate environment and rotate out of homebuilders after a strong multiyear run. At the same time, Lennar has continued to highlight its focus on disciplined land acquisitions, build-to-rent partnerships, and maintaining a strong balance sheet, which may matter more than daily price swings.
- Right now, Lennar only scores a 1 out of 6 on our undervaluation checks, so we will unpack what different valuation methods are saying about that number, and then finish by looking at a more holistic way to judge whether the stock is genuinely good value.
Lennar scores just 1/6 on our valuation checks. See what other red flags we found in the full valuation breakdown.
Approach 1: Lennar Discounted Cash Flow (DCF) Analysis
A Discounted Cash Flow model estimates what a business is worth today by projecting the cash it can generate in the future and discounting those cash flows back to the present.
For Lennar, the latest twelve months Free Cash Flow is roughly negative $703.5 Million, reflecting a period of heavy investment and working capital swings rather than steady cash generation. Analysts and Simply Wall St then project a recovery, with Free Cash Flow expected to reach about $1.25 Billion in 2026 and $1.82 Billion in 2027, before gradually normalizing over the following years as the housing cycle matures. Beyond the explicit analyst horizon, the remaining 10 year path is extrapolated rather than directly forecast by analysts.
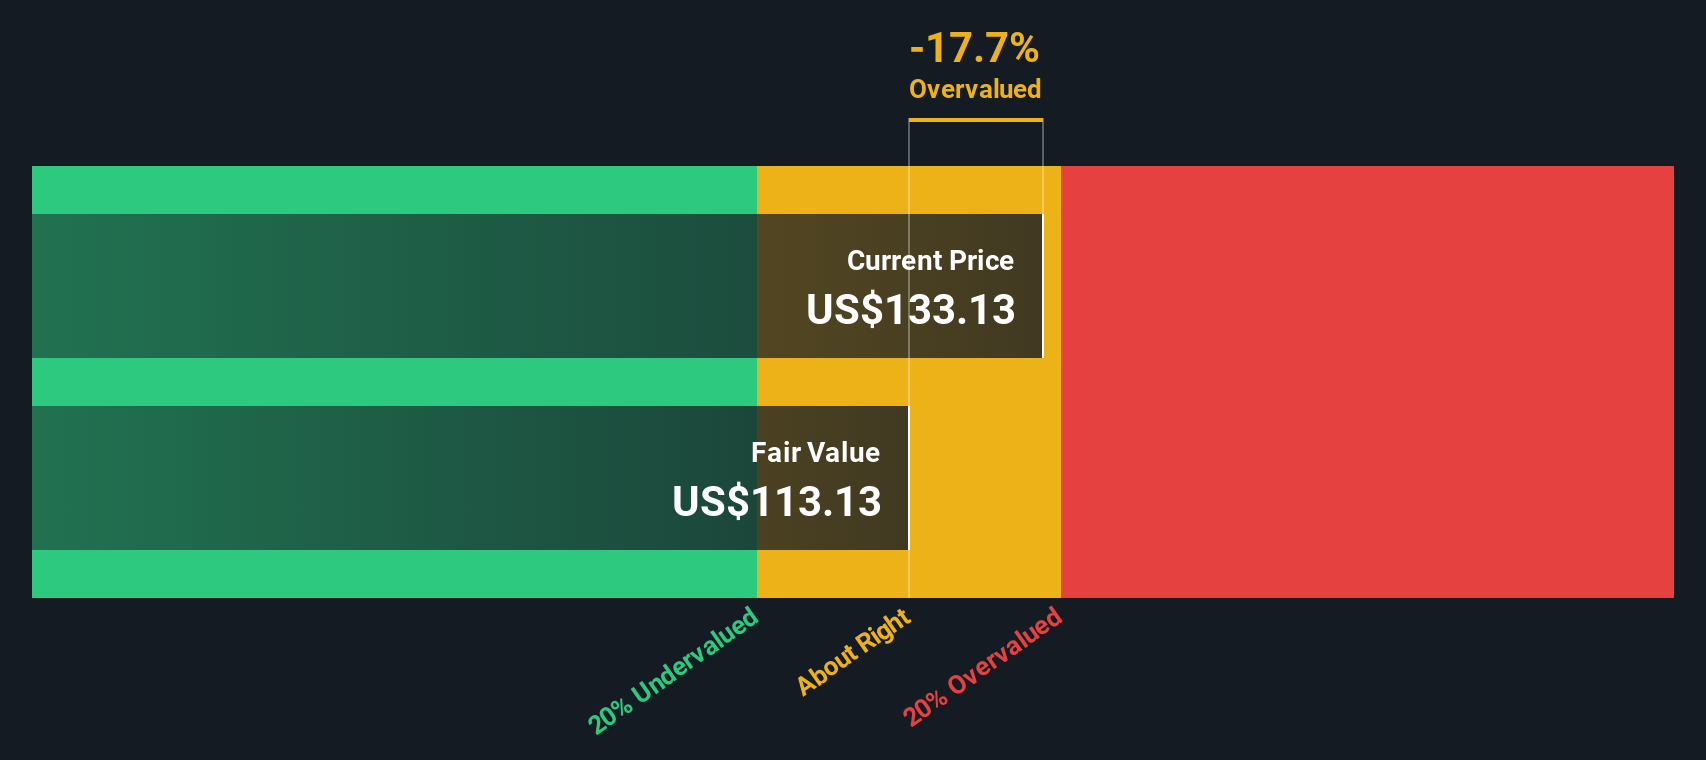
When these projected cash flows are discounted back under a 2 Stage Free Cash Flow to Equity model, the intrinsic value for Lennar is estimated at about $94.27 per share. That implies the current share price sits roughly 14.9% above this DCF estimate, suggesting the market is paying a premium for the company’s prospects.
Result: OVERVALUED
Our Discounted Cash Flow (DCF) analysis suggests Lennar may be overvalued by 14.9%. Discover 916 undervalued stocks or create your own screener to find better value opportunities.
Approach 2: Lennar Price vs Earnings
For consistently profitable companies like Lennar, the Price to Earnings (PE) ratio is a straightforward way to gauge how much investors are willing to pay for each dollar of current earnings. A higher PE can be justified when a business has stronger growth prospects or lower perceived risk, while slower growing or more cyclical companies typically deserve a lower, more conservative multiple.
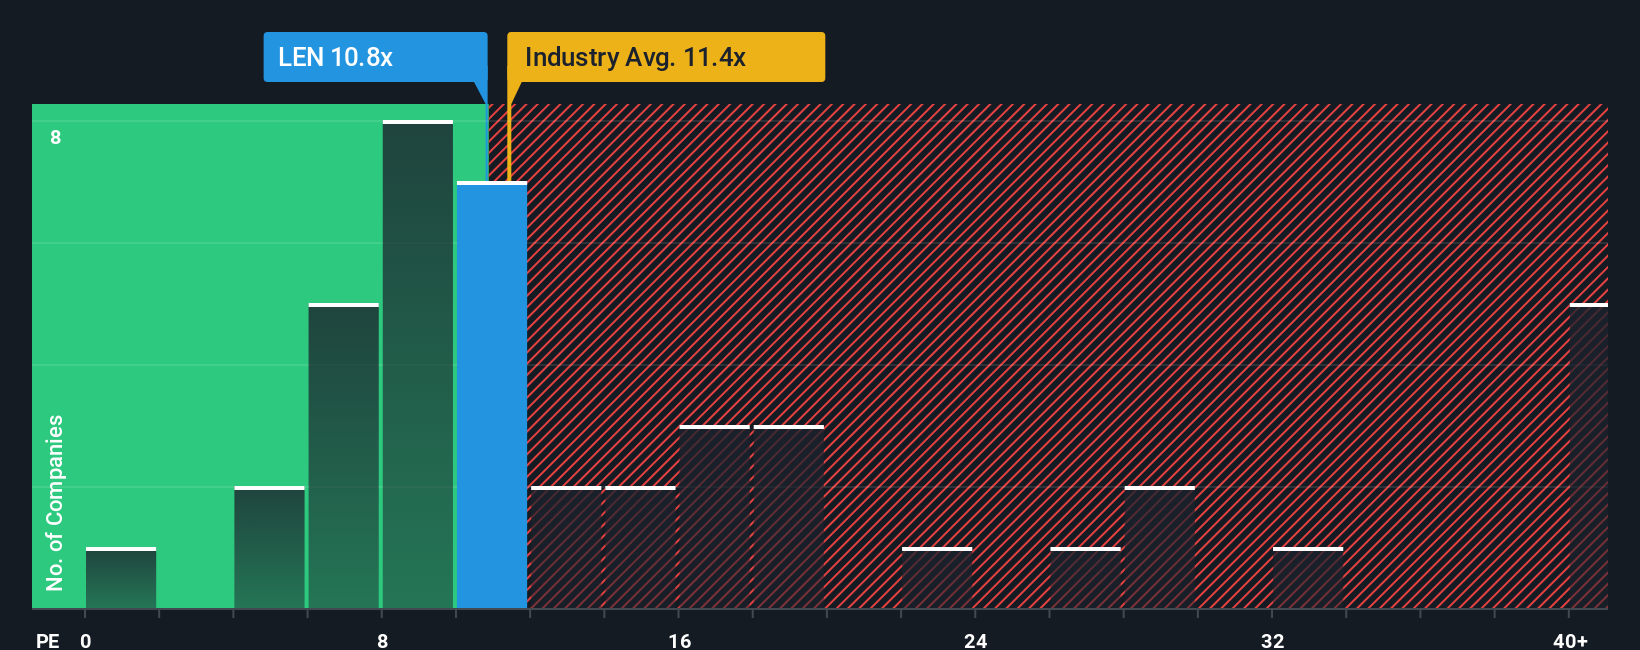
Lennar currently trades on a PE of about 12.88x, which is modestly above the Consumer Durables industry average of roughly 11.10x and the peer average of about 11.54x. On the surface, that suggests investors are paying a slight premium versus other homebuilders and related names.
Simply Wall St also calculates a proprietary Fair Ratio of 19.50x for Lennar. This represents the PE that would be expected given the company’s earnings growth outlook, profitability, industry positioning, market cap and specific risks. Because it blends these fundamentals into a single benchmark, the Fair Ratio provides a more tailored reference point than simply comparing Lennar with broad industry or peer averages. With the stock trading at 12.88x versus a Fair Ratio of 19.50x, Lennar appears attractively priced on this metric.
Result: UNDERVALUED
PE ratios tell one story, but what if the real opportunity lies elsewhere? Discover 1455 companies where insiders are betting big on explosive growth.
Upgrade Your Decision Making: Choose your Lennar Narrative
Earlier we mentioned that there is an even better way to understand valuation, so let us introduce you to Narratives, a simple way for you to attach a clear story to your numbers by linking what you believe about a company’s future revenue, earnings and margins to a financial forecast and then to a specific fair value estimate. On Simply Wall St, Narratives live inside the Community page and are used by millions of investors as an accessible tool to spell out their assumptions, generate a forecast, and instantly compare their Fair Value to the current share price to decide whether Lennar looks like a buy, a hold, or a sell. Because Narratives update dynamically as new information comes in, from earnings releases to housing market news, they help your view evolve in real time instead of being locked to a static model. For example, one Lennar Narrative on the platform might see fair value near $95 based on slower growth and margin pressure, while another pins fair value closer to $160 on a more optimistic view of demand recovery and profitability, giving you a clear spectrum of informed perspectives rather than a single “take it or leave it” number.
Do you think there's more to the story for Lennar? Head over to our Community to see what others are saying!
This article by Simply Wall St is general in nature. We provide commentary based on historical data and analyst forecasts only using an unbiased methodology and our articles are not intended to be financial advice. It does not constitute a recommendation to buy or sell any stock, and does not take account of your objectives, or your financial situation. We aim to bring you long-term focused analysis driven by fundamental data. Note that our analysis may not factor in the latest price-sensitive company announcements or qualitative material. Simply Wall St has no position in any stocks mentioned.
Mobile Infrastructure for Defense and Disaster
The next wave in robotics isn't humanoid. Its fully autonomous towers delivering 5G, ISR, and radar in under 30 minutes, anywhere.
Get the investor briefing before the next round of contracts
Sponsored On Behalf of CiTechNew: AI Stock Screener & Alerts
Our new AI Stock Screener scans the market every day to uncover opportunities.
• Dividend Powerhouses (3%+ Yield)
• Undervalued Small Caps with Insider Buying
• High growth Tech and AI Companies
Or build your own from over 50 metrics.
Have feedback on this article? Concerned about the content? Get in touch with us directly. Alternatively, email editorial-team@simplywallst.com
About NYSE:LEN
Lennar
Operates as a homebuilder primarily under the Lennar brand in the United States.
Excellent balance sheet average dividend payer.
Similar Companies
Market Insights


Weekly Picks

Early mover in a fast growing industry. Likely to experience share price volatility as they scale


A case for CA$31.80 (undiluted), aka 8,616% upside from CA$0.37 (an 86 bagger!).


Moderation and Stabilisation: HOLD: Fair Price based on a 4-year Cycle is $12.08
Recently Updated Narratives


Title: Market Sentiment Is Dead Wrong — Here's Why PSEC Deserves a Second Look


An amazing opportunity to potentially get a 100 bagger

Amazon: Why the World’s Biggest Platform Still Runs on Invisible Economics
Popular Narratives


Crazy Undervalued 42 Baggers Silver Play (Active & Running Mine)


MicroVision will explode future revenue by 380.37% with a vision towards success


NVDA: Expanding AI Demand Will Drive Major Data Center Investments Through 2026
Trending Discussion
