
Advertisement
- United States
- /
- Leisure
- /
- NasdaqGS:SWBI
Despite lower earnings than a year ago, Smith & Wesson Brands (NASDAQ:SWBI) investors are up 41% since then

Passive investing in index funds can generate returns that roughly match the overall market. But investors can boost returns by picking market-beating companies to own shares in. For example, the Smith & Wesson Brands, Inc. (NASDAQ:SWBI) share price is up 35% in the last 1 year, clearly besting the market return of around 16% (not including dividends). That's a solid performance by our standards! Unfortunately the longer term returns are not so good, with the stock falling 18% in the last three years.
While this past week has detracted from the company's one-year return, let's look at the recent trends of the underlying business and see if the gains have been in alignment.
Check out our latest analysis for Smith & Wesson Brands
To paraphrase Benjamin Graham: Over the short term the market is a voting machine, but over the long term it's a weighing machine. By comparing earnings per share (EPS) and share price changes over time, we can get a feel for how investor attitudes to a company have morphed over time.
During the last year, Smith & Wesson Brands actually saw its earnings per share drop 63%.
This means it's unlikely the market is judging the company based on earnings growth. Indeed, when EPS is declining but the share price is up, it often means the market is considering other factors.
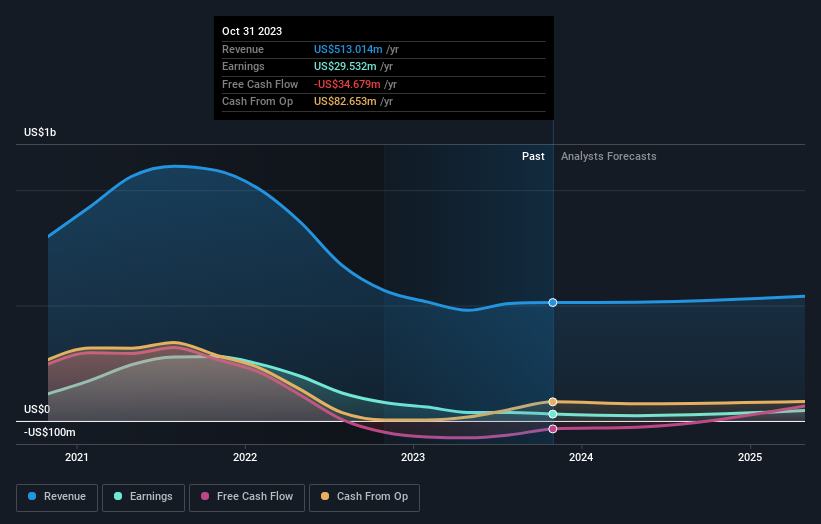
Smith & Wesson Brands' revenue actually dropped 9.1% over last year. So using a snapshot of key business metrics doesn't give us a good picture of why the market is bidding up the stock.
The graphic below depicts how earnings and revenue have changed over time (unveil the exact values by clicking on the image).
You can see how its balance sheet has strengthened (or weakened) over time in this free interactive graphic.
What About Dividends?
As well as measuring the share price return, investors should also consider the total shareholder return (TSR). The TSR incorporates the value of any spin-offs or discounted capital raisings, along with any dividends, based on the assumption that the dividends are reinvested. So for companies that pay a generous dividend, the TSR is often a lot higher than the share price return. As it happens, Smith & Wesson Brands' TSR for the last 1 year was 41%, which exceeds the share price return mentioned earlier. And there's no prize for guessing that the dividend payments largely explain the divergence!
A Different Perspective
We're pleased to report that Smith & Wesson Brands shareholders have received a total shareholder return of 41% over one year. Of course, that includes the dividend. That gain is better than the annual TSR over five years, which is 6%. Therefore it seems like sentiment around the company has been positive lately. Given the share price momentum remains strong, it might be worth taking a closer look at the stock, lest you miss an opportunity. It's always interesting to track share price performance over the longer term. But to understand Smith & Wesson Brands better, we need to consider many other factors. For instance, we've identified 2 warning signs for Smith & Wesson Brands that you should be aware of.
For those who like to find winning investments this free list of growing companies with recent insider purchasing, could be just the ticket.
Please note, the market returns quoted in this article reflect the market weighted average returns of stocks that currently trade on American exchanges.
New: Manage All Your Stock Portfolios in One Place
We've created the ultimate portfolio companion for stock investors, and it's free.
• Connect an unlimited number of Portfolios and see your total in one currency
• Be alerted to new Warning Signs or Risks via email or mobile
• Track the Fair Value of your stocks
Have feedback on this article? Concerned about the content? Get in touch with us directly. Alternatively, email editorial-team (at) simplywallst.com.
This article by Simply Wall St is general in nature. We provide commentary based on historical data and analyst forecasts only using an unbiased methodology and our articles are not intended to be financial advice. It does not constitute a recommendation to buy or sell any stock, and does not take account of your objectives, or your financial situation. We aim to bring you long-term focused analysis driven by fundamental data. Note that our analysis may not factor in the latest price-sensitive company announcements or qualitative material. Simply Wall St has no position in any stocks mentioned.
About NasdaqGS:SWBI
Smith & Wesson Brands
Designs, manufactures, and sells firearms worldwide.
Undervalued with excellent balance sheet.
Similar Companies
Market Insights

Advertisement
Community Narratives
Groundbreaking therapies that could change the treatment landscape for PTSD, fibromyalgia, MS & Alzheimer’s
Fair Value US$6.20|86.9% undervalued
CM
Community Contributor
DigitalOcean Will Grow 14% by Embracing AI with Paperspace Acquisition
Fair Value US$50.00|40.2% undervalued
NE
Community Contributor
Viant Technology: A Rising AdTech Challenger in the AI-Powered CTV Market
Fair Value US$38.61|62.7% undervalued
BL
Community Contributor
Volvo will Accelerate Forward into Electric and Autonomous Leadership in Five Years
Fair Value SEK 438.80|40.1% undervalued
UN
Community Contributor