- United States
- /
- Luxury
- /
- NasdaqGM:SGC
Market Participants Recognise Superior Group of Companies, Inc.'s (NASDAQ:SGC) Revenues Pushing Shares 26% Higher


Despite an already strong run, Superior Group of Companies, Inc. (NASDAQ:SGC) shares have been powering on, with a gain of 26% in the last thirty days. The last month tops off a massive increase of 126% in the last year.
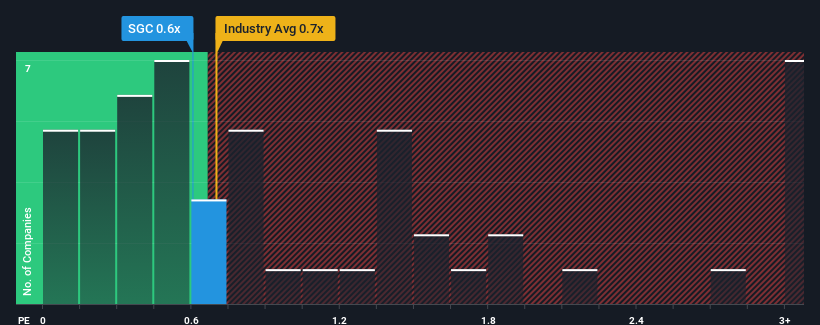
Although its price has surged higher, you could still be forgiven for feeling indifferent about Superior Group of Companies' P/S ratio of 0.6x, since the median price-to-sales (or "P/S") ratio for the Luxury industry in the United States is also close to 0.7x. Although, it's not wise to simply ignore the P/S without explanation as investors may be disregarding a distinct opportunity or a costly mistake.
Check out our latest analysis for Superior Group of Companies
What Does Superior Group of Companies' P/S Mean For Shareholders?
Superior Group of Companies could be doing better as its revenue has been going backwards lately while most other companies have been seeing positive revenue growth. Perhaps the market is expecting its poor revenue performance to improve, keeping the P/S from dropping. However, if this isn't the case, investors might get caught out paying too much for the stock.
Keen to find out how analysts think Superior Group of Companies' future stacks up against the industry? In that case, our free report is a great place to start.How Is Superior Group of Companies' Revenue Growth Trending?
In order to justify its P/S ratio, Superior Group of Companies would need to produce growth that's similar to the industry.
In reviewing the last year of financials, we were disheartened to see the company's revenues fell to the tune of 2.6%. This means it has also seen a slide in revenue over the longer-term as revenue is down 3.8% in total over the last three years. Therefore, it's fair to say the revenue growth recently has been undesirable for the company.
Looking ahead now, revenue is anticipated to climb by 4.4% during the coming year according to the two analysts following the company. That's shaping up to be similar to the 5.3% growth forecast for the broader industry.
With this in mind, it makes sense that Superior Group of Companies' P/S is closely matching its industry peers. Apparently shareholders are comfortable to simply hold on while the company is keeping a low profile.
What Does Superior Group of Companies' P/S Mean For Investors?
Superior Group of Companies' stock has a lot of momentum behind it lately, which has brought its P/S level with the rest of the industry. It's argued the price-to-sales ratio is an inferior measure of value within certain industries, but it can be a powerful business sentiment indicator.
Our look at Superior Group of Companies' revenue growth estimates show that its P/S is about what we expect, as both metrics follow closely with the industry averages. Right now shareholders are comfortable with the P/S as they are quite confident future revenue won't throw up any surprises. Unless these conditions change, they will continue to support the share price at these levels.
You always need to take note of risks, for example - Superior Group of Companies has 1 warning sign we think you should be aware of.
If companies with solid past earnings growth is up your alley, you may wish to see this free collection of other companies with strong earnings growth and low P/E ratios.
New: Manage All Your Stock Portfolios in One Place
We've created the ultimate portfolio companion for stock investors, and it's free.
• Connect an unlimited number of Portfolios and see your total in one currency
• Be alerted to new Warning Signs or Risks via email or mobile
• Track the Fair Value of your stocks
Have feedback on this article? Concerned about the content? Get in touch with us directly. Alternatively, email editorial-team (at) simplywallst.com.
This article by Simply Wall St is general in nature. We provide commentary based on historical data and analyst forecasts only using an unbiased methodology and our articles are not intended to be financial advice. It does not constitute a recommendation to buy or sell any stock, and does not take account of your objectives, or your financial situation. We aim to bring you long-term focused analysis driven by fundamental data. Note that our analysis may not factor in the latest price-sensitive company announcements or qualitative material. Simply Wall St has no position in any stocks mentioned.
About NasdaqGM:SGC
Superior Group of Companies
Manufactures and sells apparel and accessories in the United States and internationally.
Flawless balance sheet established dividend payer.

