
Advertisement
Warren Buffett famously said, 'Volatility is far from synonymous with risk.' So it might be obvious that you need to consider debt, when you think about how risky any given stock is, because too much debt can sink a company. We can see that P&F Industries, Inc. (NASDAQ:PFIN) does use debt in its business. But the more important question is: how much risk is that debt creating?
When Is Debt Dangerous?
Debt assists a business until the business has trouble paying it off, either with new capital or with free cash flow. Ultimately, if the company can't fulfill its legal obligations to repay debt, shareholders could walk away with nothing. While that is not too common, we often do see indebted companies permanently diluting shareholders because lenders force them to raise capital at a distressed price. Of course, debt can be an important tool in businesses, particularly capital heavy businesses. The first thing to do when considering how much debt a business uses is to look at its cash and debt together.
View our latest analysis for P&F Industries
How Much Debt Does P&F Industries Carry?
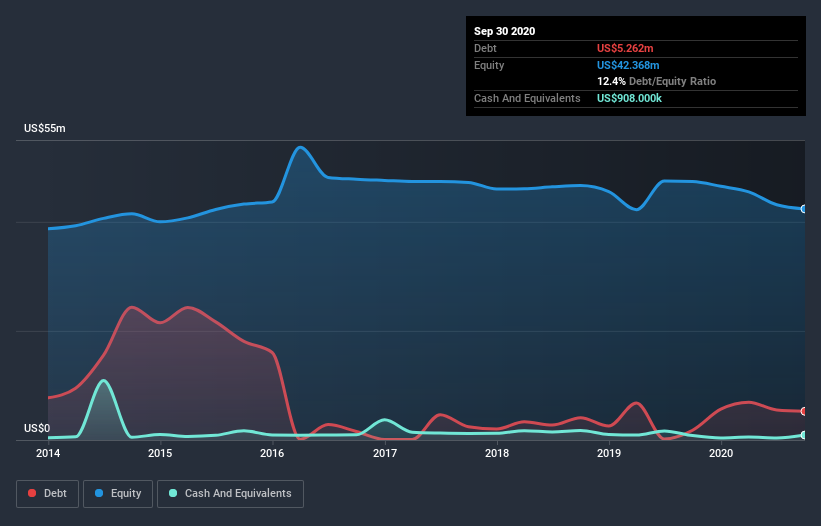
As you can see below, at the end of September 2020, P&F Industries had US$5.26m of debt, up from US$1.79m a year ago. Click the image for more detail. On the flip side, it has US$908.0k in cash leading to net debt of about US$4.35m.
How Healthy Is P&F Industries's Balance Sheet?
Zooming in on the latest balance sheet data, we can see that P&F Industries had liabilities of US$9.76m due within 12 months and liabilities of US$3.91m due beyond that. On the other hand, it had cash of US$908.0k and US$8.55m worth of receivables due within a year. So it has liabilities totalling US$4.21m more than its cash and near-term receivables, combined.
P&F Industries has a market capitalization of US$15.2m, so it could very likely raise cash to ameliorate its balance sheet, if the need arose. But it's clear that we should definitely closely examine whether it can manage its debt without dilution. The balance sheet is clearly the area to focus on when you are analysing debt. But it is P&F Industries's earnings that will influence how the balance sheet holds up in the future. So when considering debt, it's definitely worth looking at the earnings trend. Click here for an interactive snapshot.
In the last year P&F Industries had a loss before interest and tax, and actually shrunk its revenue by 12%, to US$52m. We would much prefer see growth.
Caveat Emptor
Not only did P&F Industries's revenue slip over the last twelve months, but it also produced negative earnings before interest and tax (EBIT). Indeed, it lost a very considerable US$4.9m at the EBIT level. Considering that alongside the liabilities mentioned above does not give us much confidence that company should be using so much debt. Quite frankly we think the balance sheet is far from match-fit, although it could be improved with time. For example, we would not want to see a repeat of last year's loss of US$4.9m. So we do think this stock is quite risky. There's no doubt that we learn most about debt from the balance sheet. But ultimately, every company can contain risks that exist outside of the balance sheet. Be aware that P&F Industries is showing 1 warning sign in our investment analysis , you should know about...
If, after all that, you're more interested in a fast growing company with a rock-solid balance sheet, then check out our list of net cash growth stocks without delay.
If you decide to trade P&F Industries, use the lowest-cost* platform that is rated #1 Overall by Barron’s, Interactive Brokers. Trade stocks, options, futures, forex, bonds and funds on 135 markets, all from a single integrated account. Promoted
New: Manage All Your Stock Portfolios in One Place
We've created the ultimate portfolio companion for stock investors, and it's free.
• Connect an unlimited number of Portfolios and see your total in one currency
• Be alerted to new Warning Signs or Risks via email or mobile
• Track the Fair Value of your stocks
This article by Simply Wall St is general in nature. It does not constitute a recommendation to buy or sell any stock, and does not take account of your objectives, or your financial situation. We aim to bring you long-term focused analysis driven by fundamental data. Note that our analysis may not factor in the latest price-sensitive company announcements or qualitative material. Simply Wall St has no position in any stocks mentioned.
*Interactive Brokers Rated Lowest Cost Broker by StockBrokers.com Annual Online Review 2020
Have feedback on this article? Concerned about the content? Get in touch with us directly. Alternatively, email editorial-team@simplywallst.com.
About NasdaqGM:PFIN
P&F Industries
P&F Industries, Inc., through its subsidiaries, designs, imports, manufactures, and sells pneumatic hand tools primarily to the retail, industrial, automotive, and aerospace markets primarily in the United States.
Excellent balance sheet and fair value.
Market Insights

Advertisement
Community Narratives
The Next Phase of Energy Storage: How NeoVolta Is Tackling America’s Power Crunch
Fair Value US$7.50|35.1% undervalued
MA
Community Contributor
Why EnSilica is Worth Possibly 13x its Current Price
Fair Value UK£5.00|89.8% undervalued
DO
Community Contributor
M&A Activity, Industry Diversification & A Defense Contract Monopoly Will Push BWXT For Healthy Long-Term Growth
Fair Value US$220.00|15.2% undervalued
CL
Community Contributor
A case for Cassiar Gold Corp (TSXV: GLDC) to reach CAD$8-10 before 2030 (X30-37)
Fair Value CA$10.00|96.0% undervalued
AG
Community Contributor