
Advertisement
- United States
- /
- Consumer Durables
- /
- NasdaqGS:LCUT
Lifetime Brands, Inc.'s (NASDAQ:LCUT) 29% Share Price Surge Not Quite Adding Up
Lifetime Brands, Inc. (NASDAQ:LCUT) shares have continued their recent momentum with a 29% gain in the last month alone. The bad news is that even after the stocks recovery in the last 30 days, shareholders are still underwater by about 4.3% over the last year.
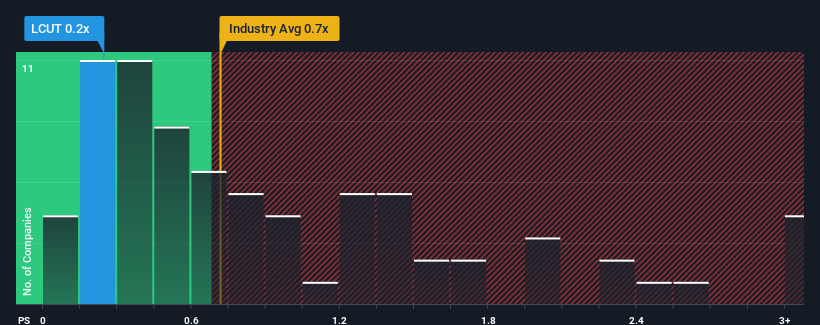
Although its price has surged higher, it's still not a stretch to say that Lifetime Brands' price-to-sales (or "P/S") ratio of 0.2x right now seems quite "middle-of-the-road" compared to the Consumer Durables industry in the United States, where the median P/S ratio is around 0.7x. However, investors might be overlooking a clear opportunity or potential setback if there is no rational basis for the P/S.
View our latest analysis for Lifetime Brands
How Has Lifetime Brands Performed Recently?
While the industry has experienced revenue growth lately, Lifetime Brands' revenue has gone into reverse gear, which is not great. One possibility is that the P/S ratio is moderate because investors think this poor revenue performance will turn around. You'd really hope so, otherwise you're paying a relatively elevated price for a company with this sort of growth profile.
If you'd like to see what analysts are forecasting going forward, you should check out our free report on Lifetime Brands.Do Revenue Forecasts Match The P/S Ratio?
The only time you'd be comfortable seeing a P/S like Lifetime Brands' is when the company's growth is tracking the industry closely.
Taking a look back first, the company's revenue growth last year wasn't something to get excited about as it posted a disappointing decline of 11%. The last three years don't look nice either as the company has shrunk revenue by 7.5% in aggregate. Therefore, it's fair to say the revenue growth recently has been undesirable for the company.
Turning to the outlook, the next three years should generate growth of 1.4% per annum as estimated by the three analysts watching the company. That's shaping up to be materially lower than the 4.2% per annum growth forecast for the broader industry.
In light of this, it's curious that Lifetime Brands' P/S sits in line with the majority of other companies. Apparently many investors in the company are less bearish than analysts indicate and aren't willing to let go of their stock right now. Maintaining these prices will be difficult to achieve as this level of revenue growth is likely to weigh down the shares eventually.
What We Can Learn From Lifetime Brands' P/S?
Lifetime Brands' stock has a lot of momentum behind it lately, which has brought its P/S level with the rest of the industry. Generally, our preference is to limit the use of the price-to-sales ratio to establishing what the market thinks about the overall health of a company.
Our look at the analysts forecasts of Lifetime Brands' revenue prospects has shown that its inferior revenue outlook isn't negatively impacting its P/S as much as we would have predicted. When we see companies with a relatively weaker revenue outlook compared to the industry, we suspect the share price is at risk of declining, sending the moderate P/S lower. Circumstances like this present a risk to current and prospective investors who may see share prices fall if the low revenue growth impacts the sentiment.
There are also other vital risk factors to consider and we've discovered 4 warning signs for Lifetime Brands (2 are a bit concerning!) that you should be aware of before investing here.
It's important to make sure you look for a great company, not just the first idea you come across. So if growing profitability aligns with your idea of a great company, take a peek at this free list of interesting companies with strong recent earnings growth (and a low P/E).
New: AI Stock Screener & Alerts
Our new AI Stock Screener scans the market every day to uncover opportunities.
• Dividend Powerhouses (3%+ Yield)
• Undervalued Small Caps with Insider Buying
• High growth Tech and AI Companies
Or build your own from over 50 metrics.
Have feedback on this article? Concerned about the content? Get in touch with us directly. Alternatively, email editorial-team (at) simplywallst.com.
This article by Simply Wall St is general in nature. We provide commentary based on historical data and analyst forecasts only using an unbiased methodology and our articles are not intended to be financial advice. It does not constitute a recommendation to buy or sell any stock, and does not take account of your objectives, or your financial situation. We aim to bring you long-term focused analysis driven by fundamental data. Note that our analysis may not factor in the latest price-sensitive company announcements or qualitative material. Simply Wall St has no position in any stocks mentioned.
About NasdaqGS:LCUT
Lifetime Brands
Designs, sources, and sells branded kitchenware, tableware, and other products for use in the home in the United States and internationally.
Undervalued with excellent balance sheet and pays a dividend.
Similar Companies
Market Insights

Advertisement
Community Narratives
The Next Phase of Energy Storage: How NeoVolta Is Tackling America’s Power Crunch
Fair Value US$7.50|35.1% undervalued
MA
Community Contributor
Why EnSilica is Worth Possibly 13x its Current Price
Fair Value UK£5.00|89.8% undervalued
DO
Community Contributor
M&A Activity, Industry Diversification & A Defense Contract Monopoly Will Push BWXT For Healthy Long-Term Growth
Fair Value US$220.00|15.2% undervalued
CL
Community Contributor
A case for Cassiar Gold Corp (TSXV: GLDC) to reach CAD$8-10 before 2030 (X30-37)
Fair Value CA$10.00|96.0% undervalued
AG
Community Contributor