- United States
- /
- Leisure
- /
- NasdaqGS:JAKK
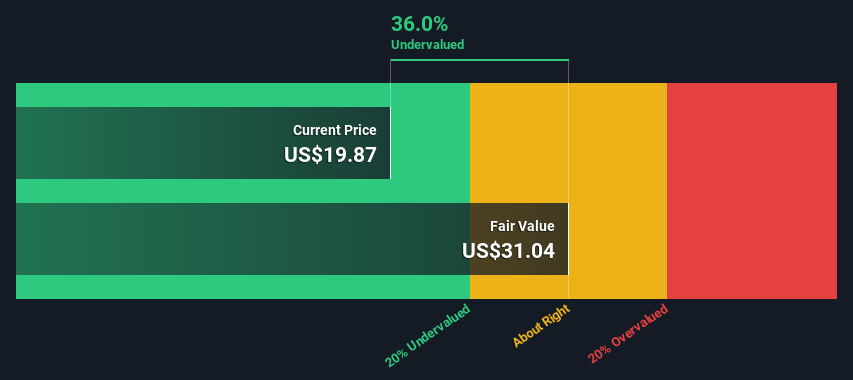
Are Investors Undervaluing JAKKS Pacific, Inc. (NASDAQ:JAKK) By 36%?


Key Insights
- The projected fair value for JAKKS Pacific is US$31.04 based on 2 Stage Free Cash Flow to Equity
- Current share price of US$19.87 suggests JAKKS Pacific is potentially 36% undervalued
- Analyst price target for JAKK is US$28.33 which is 8.7% below our fair value estimate
In this article we are going to estimate the intrinsic value of JAKKS Pacific, Inc. (NASDAQ:JAKK) by estimating the company's future cash flows and discounting them to their present value. We will take advantage of the Discounted Cash Flow (DCF) model for this purpose. It may sound complicated, but actually it is quite simple!
We would caution that there are many ways of valuing a company and, like the DCF, each technique has advantages and disadvantages in certain scenarios. If you still have some burning questions about this type of valuation, take a look at the Simply Wall St analysis model.
View our latest analysis for JAKKS Pacific
The Calculation
We use what is known as a 2-stage model, which simply means we have two different periods of growth rates for the company's cash flows. Generally the first stage is higher growth, and the second stage is a lower growth phase. To begin with, we have to get estimates of the next ten years of cash flows. Where possible we use analyst estimates, but when these aren't available we extrapolate the previous free cash flow (FCF) from the last estimate or reported value. We assume companies with shrinking free cash flow will slow their rate of shrinkage, and that companies with growing free cash flow will see their growth rate slow, over this period. We do this to reflect that growth tends to slow more in the early years than it does in later years.
Generally we assume that a dollar today is more valuable than a dollar in the future, and so the sum of these future cash flows is then discounted to today's value:
10-year free cash flow (FCF) estimate
| 2023 | 2024 | 2025 | 2026 | 2027 | 2028 | 2029 | 2030 | 2031 | 2032 | |
| Levered FCF ($, Millions) | US$114.5m | US$56.3m | US$32.0m | US$22.5m | US$18.0m | US$15.6m | US$14.2m | US$13.4m | US$13.0m | US$12.8m |
| Growth Rate Estimate Source | Analyst x1 | Analyst x1 | Est @ -43.18% | Est @ -29.59% | Est @ -20.08% | Est @ -13.42% | Est @ -8.76% | Est @ -5.50% | Est @ -3.22% | Est @ -1.62% |
| Present Value ($, Millions) Discounted @ 9.6% | US$104 | US$46.9 | US$24.3 | US$15.6 | US$11.4 | US$9.0 | US$7.5 | US$6.5 | US$5.7 | US$5.1 |
("Est" = FCF growth rate estimated by Simply Wall St)
Present Value of 10-year Cash Flow (PVCF) = US$236m
We now need to calculate the Terminal Value, which accounts for all the future cash flows after this ten year period. For a number of reasons a very conservative growth rate is used that cannot exceed that of a country's GDP growth. In this case we have used the 5-year average of the 10-year government bond yield (2.1%) to estimate future growth. In the same way as with the 10-year 'growth' period, we discount future cash flows to today's value, using a cost of equity of 9.6%.
Terminal Value (TV)= FCF2032 × (1 + g) ÷ (r – g) = US$13m× (1 + 2.1%) ÷ (9.6%– 2.1%) = US$175m
Present Value of Terminal Value (PVTV)= TV / (1 + r)10= US$175m÷ ( 1 + 9.6%)10= US$70m
The total value, or equity value, is then the sum of the present value of the future cash flows, which in this case is US$306m. In the final step we divide the equity value by the number of shares outstanding. Relative to the current share price of US$19.9, the company appears quite undervalued at a 36% discount to where the stock price trades currently. Remember though, that this is just an approximate valuation, and like any complex formula - garbage in, garbage out.
Important Assumptions
The calculation above is very dependent on two assumptions. The first is the discount rate and the other is the cash flows. You don't have to agree with these inputs, I recommend redoing the calculations yourself and playing with them. The DCF also does not consider the possible cyclicality of an industry, or a company's future capital requirements, so it does not give a full picture of a company's potential performance. Given that we are looking at JAKKS Pacific as potential shareholders, the cost of equity is used as the discount rate, rather than the cost of capital (or weighted average cost of capital, WACC) which accounts for debt. In this calculation we've used 9.6%, which is based on a levered beta of 1.259. Beta is a measure of a stock's volatility, compared to the market as a whole. We get our beta from the industry average beta of globally comparable companies, with an imposed limit between 0.8 and 2.0, which is a reasonable range for a stable business.
SWOT Analysis for JAKKS Pacific
- Earnings growth over the past year exceeded the industry.
- Debt is not viewed as a risk.
- Shareholders have been diluted in the past year.
- Trading below our estimate of fair value by more than 20%.
- Annual earnings are forecast to decline for the next 2 years.
Next Steps:
Valuation is only one side of the coin in terms of building your investment thesis, and it shouldn't be the only metric you look at when researching a company. It's not possible to obtain a foolproof valuation with a DCF model. Preferably you'd apply different cases and assumptions and see how they would impact the company's valuation. For instance, if the terminal value growth rate is adjusted slightly, it can dramatically alter the overall result. Can we work out why the company is trading at a discount to intrinsic value? For JAKKS Pacific, we've put together three fundamental items you should assess:
- Risks: We feel that you should assess the 2 warning signs for JAKKS Pacific (1 is a bit concerning!) we've flagged before making an investment in the company.
- Future Earnings: How does JAKK's growth rate compare to its peers and the wider market? Dig deeper into the analyst consensus number for the upcoming years by interacting with our free analyst growth expectation chart.
- Other Solid Businesses: Low debt, high returns on equity and good past performance are fundamental to a strong business. Why not explore our interactive list of stocks with solid business fundamentals to see if there are other companies you may not have considered!
PS. The Simply Wall St app conducts a discounted cash flow valuation for every stock on the NASDAQGS every day. If you want to find the calculation for other stocks just search here.
If you're looking to trade JAKKS Pacific, open an account with the lowest-cost platform trusted by professionals, Interactive Brokers.
With clients in over 200 countries and territories, and access to 160 markets, IBKR lets you trade stocks, options, futures, forex, bonds and funds from a single integrated account.
Enjoy no hidden fees, no account minimums, and FX conversion rates as low as 0.03%, far better than what most brokers offer.
Sponsored ContentNew: Manage All Your Stock Portfolios in One Place
We've created the ultimate portfolio companion for stock investors, and it's free.
• Connect an unlimited number of Portfolios and see your total in one currency
• Be alerted to new Warning Signs or Risks via email or mobile
• Track the Fair Value of your stocks
Have feedback on this article? Concerned about the content? Get in touch with us directly. Alternatively, email editorial-team (at) simplywallst.com.
This article by Simply Wall St is general in nature. We provide commentary based on historical data and analyst forecasts only using an unbiased methodology and our articles are not intended to be financial advice. It does not constitute a recommendation to buy or sell any stock, and does not take account of your objectives, or your financial situation. We aim to bring you long-term focused analysis driven by fundamental data. Note that our analysis may not factor in the latest price-sensitive company announcements or qualitative material. Simply Wall St has no position in any stocks mentioned.
About NasdaqGS:JAKK
JAKKS Pacific
Designs, produces, markets, sells, and distributes toys and related products, consumer products, kids indoor and outdoor furniture, costumes, and sporting goods and home furnishings space products worldwide.
Flawless balance sheet with solid track record.
Similar Companies
Market Insights

Community Narratives

