Advertisement
- United States
- /
- Professional Services
- /
- NYSE:WNS
Does WNS Deserve a Closer Look After Climbing Over 60% in 2024?

Simply Wall St
Reviewed by Bailey Pemberton
Thinking about whether WNS (Holdings) deserves a spot in your portfolio right now? You are not alone. The stock has been on quite a journey lately, catching the eyes of both seasoned investors and curious newcomers. After all, with a remarkable year-to-date gain of 61.3% and a one-year return of 56.0%, it is hard not to notice. While the past three years have seen some bumps, including a -6.4% dip, the company’s strong rebound over the past year suggests a shift in market sentiment, possibly spurred by industry tailwinds and renewed confidence in global business services providers.
Short-term returns have been more modest, with just a 0.1% move over the past week and 1.2% over the last month. This signals that, while the fireworks may have quieted down for the moment, there could still be underlying strength beneath the surface. It is against this backdrop that WNS currently sports a value score of 4 out of 6. This means it passes four key tests for being undervalued. This raises the key question: does the recent run up in price still leave space for upside, or is the market ahead of itself?
Let us break down how WNS stacks up using classic valuation checks, and also dig into a smarter way to size up the company’s real worth. Sometimes even the savviest tools miss important details.
Approach 1: WNS (Holdings) Discounted Cash Flow (DCF) Analysis
The Discounted Cash Flow (DCF) model estimates a company’s intrinsic value by projecting its future cash flows and then discounting them back to today’s value. This approach helps investors determine what a business is truly worth, independent of market swings.
For WNS (Holdings), the most recent twelve months’ Free Cash Flow stands at $161.3 million. Analysts forecast continued growth, with projections rising to $214 million by 2028. For longer periods, cash flow growth is extrapolated, giving an estimated Free Cash Flow of $309.2 million by 2035. All figures are shown in US dollars, WNS’s reporting currency.
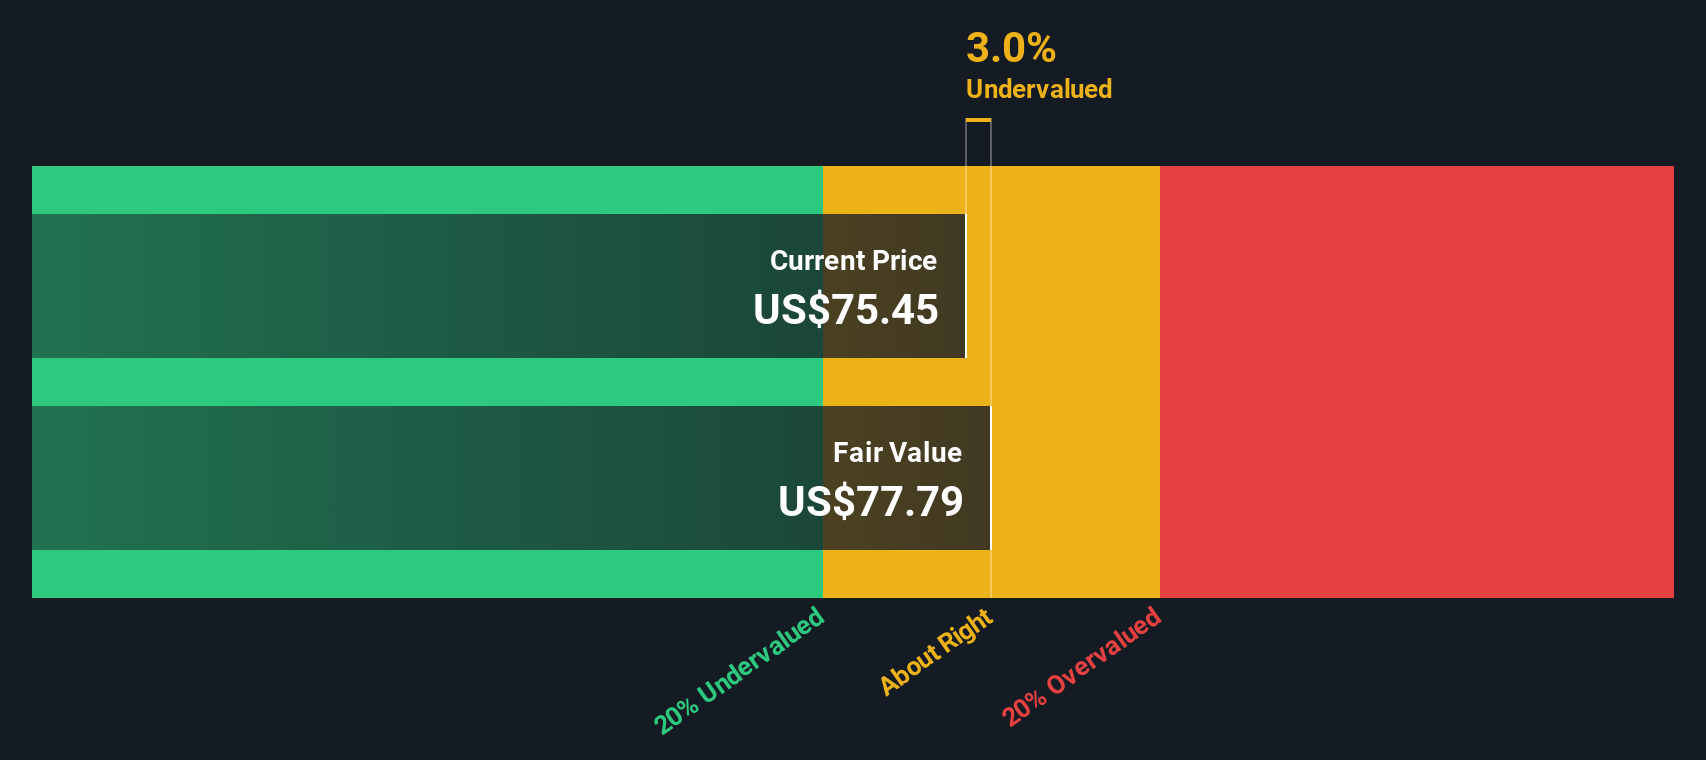
Running these numbers through the 2 Stage Free Cash Flow to Equity model gives an estimated intrinsic value of $77.81 per share. Compared to the current share price, this implies the stock is 1.9% undervalued based on this calculation.
With such a small difference, markets appear to be pricing WNS closely in line with its forecast fundamentals. The DCF model suggests there is neither a dramatic bargain nor an excessive premium at today’s prices.
Result: ABOUT RIGHT
Simply Wall St performs a valuation analysis on every stock in the world every day (check out WNS (Holdings)'s valuation analysis). We show the entire calculation in full. You can track the result in your watchlist or portfolio and be alerted when this changes.
Approach 2: WNS (Holdings) Price vs Earnings
The Price-to-Earnings (PE) ratio is a favored metric for valuing profitable companies like WNS (Holdings) because it tells investors how much they are paying for each dollar of earnings. This makes it a quick and effective way to compare value between companies and to get a sense of the market’s expectations for future growth.
It is important to remember, though, that what qualifies as a “fair” PE ratio varies depending on growth prospects, risk profile, market conditions, and the industry. Companies expected to grow faster or take on less risk often command higher PE multiples. Those facing headwinds or higher uncertainty might trade at a discount.
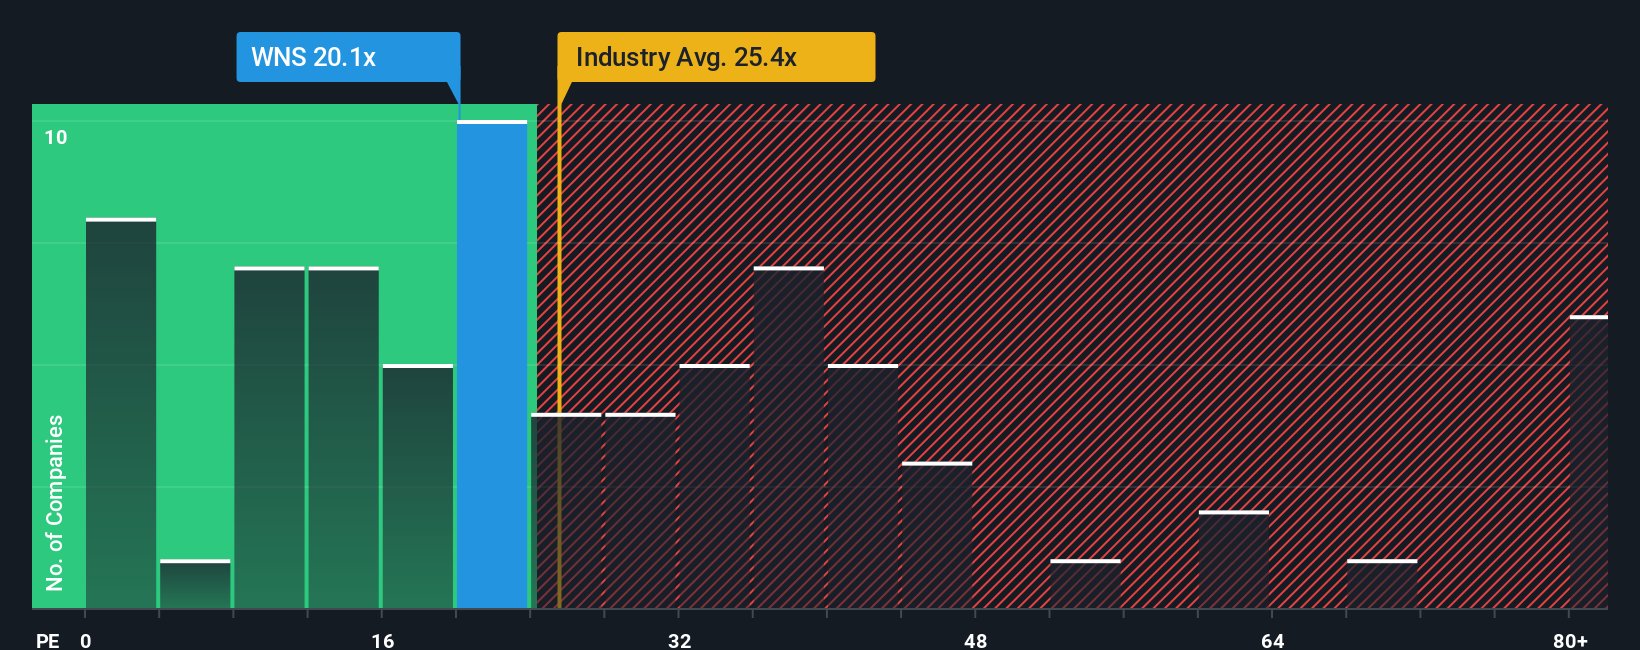
Currently, WNS trades at a PE ratio of 20.1x. That is lower than both the industry average of 26.8x and the peer group average of 30.1x. On the surface, this makes WNS look like a relative bargain compared to similar companies in the professional services sector.
However, benchmarking against industry and peers does not always capture the whole story. That is where Simply Wall St’s Fair Ratio comes in. This proprietary metric estimates what WNS’s PE ratio should be based on a thorough analysis of its growth profile, profit margins, market capitalization, risks, and its place in the industry. The Fair Ratio for WNS is 21.7x.
Because the company’s actual PE ratio (20.1x) is very close to its Fair Ratio (21.7x), the stock appears to be fairly valued on an earnings basis after taking into account its specific fundamentals.
Result: ABOUT RIGHT
PE ratios tell one story, but what if the real opportunity lies elsewhere? Discover companies where insiders are betting big on explosive growth.
Upgrade Your Decision Making: Choose your WNS (Holdings) Narrative
Earlier we mentioned that there is an even better way to understand valuation, so let us introduce you to Narratives. A Narrative is more than just numbers; it is the story behind a company from an investor’s point of view, connecting your personal view or thesis about where WNS (Holdings) is headed to concrete, forward-looking financial estimates like revenue, margin, and fair value.
With Narratives, you can see how someone’s belief in WNS’s future, whether it is bullish on AI-driven margin expansion or expects tighter growth ahead, is directly linked to their forecast and fair value. This approach makes the reasoning behind their opinion transparent and actionable. Narratives are available on Simply Wall St’s Community page, where millions of investors use them to inform buy and sell decisions by comparing what they consider to be fair value to today’s share price.
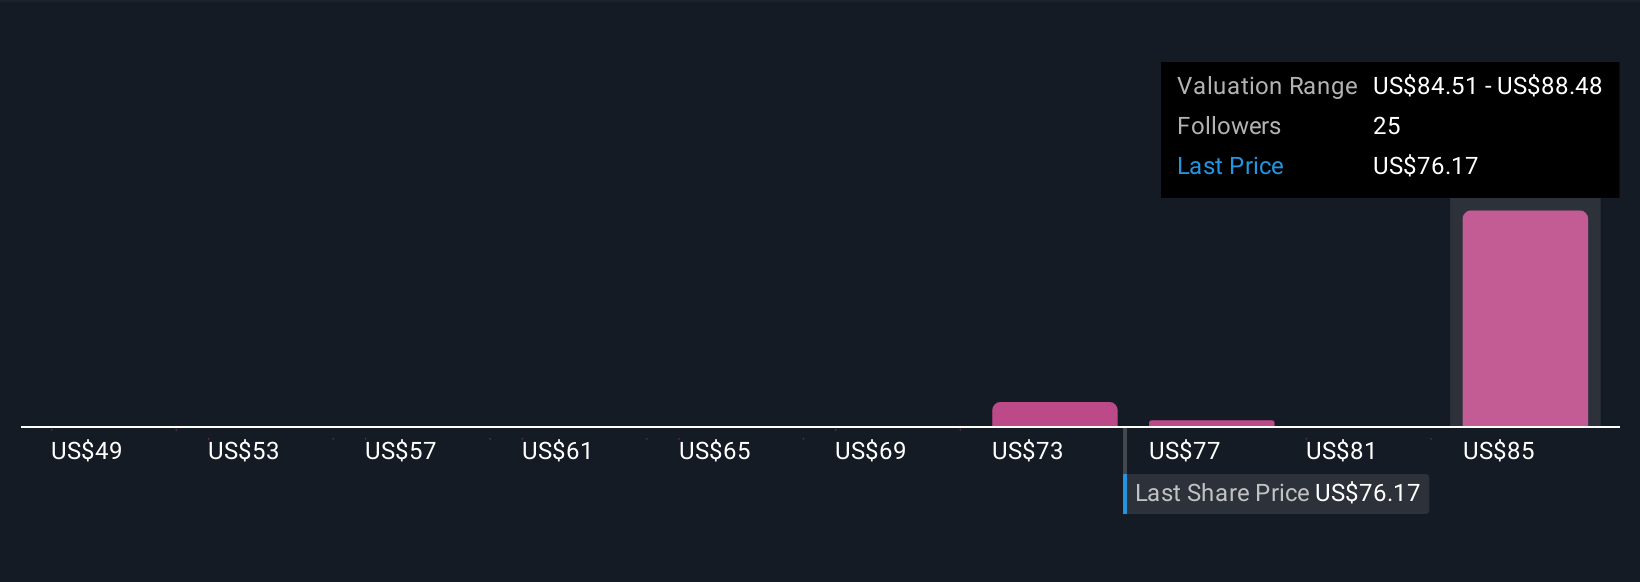
The real power of Narratives lies in their dynamic updates. When new news or earnings are released, Narratives adjust automatically to reflect the latest outlook, so you are always working with the most relevant data. For example, some investors have a Narrative for WNS built around rapid automation gains and set their fair value as high as $88.48, while others worry over margin pressures and set it closer to just $76.20. This means you can see and compare different perspectives as the market evolves.
For WNS (Holdings), it’s easy to explore the outlook with previews of two leading WNS (Holdings) narratives:
Fair Value: $88.48
Undervalued by 13.8%
Revenue Growth Rate: 7.5%
- WNS’s strategic shift towards automation and outcome-based pricing is expected to drive margin improvements and better align incentives with clients.
- The company benefits from high switching costs within the BPM industry, making customer relationships more stable and reducing the risk of client churn, even amid global changes or technological advances.
- Management, led by an experienced and highly aligned CEO, prioritizes industry expertise, capital allocation for growth, and share repurchases, which supports future profitability and resilience.
Fair Value: $76.20
Overvalued by 0.1%
Revenue Growth Rate: 7.8%
- Revenue growth and margin stability are driven by strategic AI initiatives, acquisitions, and capital allocation focused on EPS growth, but face challenges from revenue headwinds and operational risks.
- Risks include client losses, high attrition, unfavorable currency movements, and macroeconomic volatility, all of which could put pressure on earnings and margins.
- Analyst consensus sees limited current upside with the fair value close to the prevailing share price, and the PE ratio would need to expand to justify higher valuations.
Do you think there's more to the story for WNS (Holdings)? Create your own Narrative to let the Community know!
This article by Simply Wall St is general in nature. We provide commentary based on historical data and analyst forecasts only using an unbiased methodology and our articles are not intended to be financial advice. It does not constitute a recommendation to buy or sell any stock, and does not take account of your objectives, or your financial situation. We aim to bring you long-term focused analysis driven by fundamental data. Note that our analysis may not factor in the latest price-sensitive company announcements or qualitative material. Simply Wall St has no position in any stocks mentioned.
Valuation is complex, but we're here to simplify it.
Discover if WNS (Holdings) might be undervalued or overvalued with our detailed analysis, featuring fair value estimates, potential risks, dividends, insider trades, and its financial condition.
Access Free AnalysisHave feedback on this article? Concerned about the content? Get in touch with us directly. Alternatively, email editorial-team@simplywallst.com
About NYSE:WNS
WNS (Holdings)
A business process management (BPM) company, provides data, voice, analytical, and business transformation services worldwide.
Solid track record with excellent balance sheet.
Similar Companies
Market Insights

Advertisement
Community Narratives
The Next Phase of Energy Storage: How NeoVolta Is Tackling America’s Power Crunch
Fair Value US$7.50|35.1% undervalued
MA
Community Contributor
Why EnSilica is Worth Possibly 13x its Current Price
Fair Value UK£5.00|89.8% undervalued
DO
Community Contributor
M&A Activity, Industry Diversification & A Defense Contract Monopoly Will Push BWXT For Healthy Long-Term Growth
Fair Value US$220.00|15.2% undervalued
CL
Community Contributor
A case for Cassiar Gold Corp (TSXV: GLDC) to reach CAD$8-10 before 2030 (X30-37)
Fair Value CA$10.00|96.0% undervalued
AG
Community Contributor