
Advertisement
- United States
- /
- Professional Services
- /
- NYSE:TIXT
TELUS International (Cda) Inc. (NYSE:TIXT) Might Not Be As Mispriced As It Looks After Plunging 29%

Unfortunately for some shareholders, the TELUS International (Cda) Inc. (NYSE:TIXT) share price has dived 29% in the last thirty days, prolonging recent pain. For any long-term shareholders, the last month ends a year to forget by locking in a 56% share price decline.
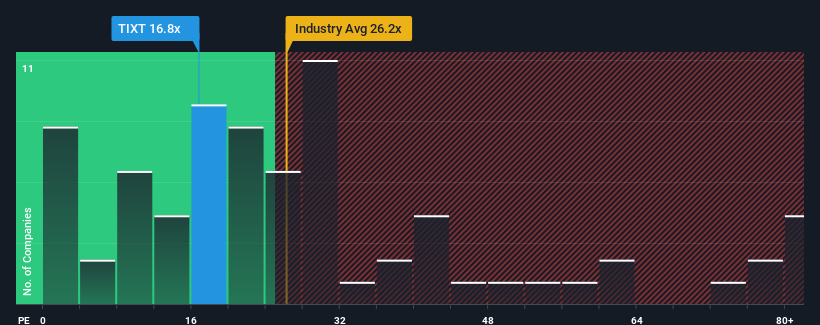
Even after such a large drop in price, it's still not a stretch to say that TELUS International (Cda)'s price-to-earnings (or "P/E") ratio of 16.8x right now seems quite "middle-of-the-road" compared to the market in the United States, where the median P/E ratio is around 18x. Although, it's not wise to simply ignore the P/E without explanation as investors may be disregarding a distinct opportunity or a costly mistake.
Recent times haven't been advantageous for TELUS International (Cda) as its earnings have been falling quicker than most other companies. One possibility is that the P/E is moderate because investors think the company's earnings trend will eventually fall in line with most others in the market. You'd much rather the company wasn't bleeding earnings if you still believe in the business. If not, then existing shareholders may be a little nervous about the viability of the share price.
View our latest analysis for TELUS International (Cda)
Does Growth Match The P/E?
TELUS International (Cda)'s P/E ratio would be typical for a company that's only expected to deliver moderate growth, and importantly, perform in line with the market.
If we review the last year of earnings, dishearteningly the company's profits fell to the tune of 59%. The last three years don't look nice either as the company has shrunk EPS by 38% in aggregate. So unfortunately, we have to acknowledge that the company has not done a great job of growing earnings over that time.
Looking ahead now, EPS is anticipated to climb by 30% each year during the coming three years according to the analysts following the company. Meanwhile, the rest of the market is forecast to only expand by 10% per annum, which is noticeably less attractive.
In light of this, it's curious that TELUS International (Cda)'s P/E sits in line with the majority of other companies. It may be that most investors aren't convinced the company can achieve future growth expectations.
What We Can Learn From TELUS International (Cda)'s P/E?
With its share price falling into a hole, the P/E for TELUS International (Cda) looks quite average now. It's argued the price-to-earnings ratio is an inferior measure of value within certain industries, but it can be a powerful business sentiment indicator.
Our examination of TELUS International (Cda)'s analyst forecasts revealed that its superior earnings outlook isn't contributing to its P/E as much as we would have predicted. There could be some unobserved threats to earnings preventing the P/E ratio from matching the positive outlook. It appears some are indeed anticipating earnings instability, because these conditions should normally provide a boost to the share price.
Before you settle on your opinion, we've discovered 4 warning signs for TELUS International (Cda) (1 is significant!) that you should be aware of.
Of course, you might also be able to find a better stock than TELUS International (Cda). So you may wish to see this free collection of other companies that have reasonable P/E ratios and have grown earnings strongly.
Valuation is complex, but we're here to simplify it.
Discover if TELUS International (Cda) might be undervalued or overvalued with our detailed analysis, featuring fair value estimates, potential risks, dividends, insider trades, and its financial condition.
Access Free AnalysisHave feedback on this article? Concerned about the content? Get in touch with us directly. Alternatively, email editorial-team (at) simplywallst.com.
This article by Simply Wall St is general in nature. We provide commentary based on historical data and analyst forecasts only using an unbiased methodology and our articles are not intended to be financial advice. It does not constitute a recommendation to buy or sell any stock, and does not take account of your objectives, or your financial situation. We aim to bring you long-term focused analysis driven by fundamental data. Note that our analysis may not factor in the latest price-sensitive company announcements or qualitative material. Simply Wall St has no position in any stocks mentioned.
Have feedback on this article? Concerned about the content? Get in touch with us directly. Alternatively, email editorial-team@simplywallst.com
About NYSE:TIXT
TELUS International (Cda)
Offers digital customer experience and digital solutions in the Asia-Pacific, the Central America, Europe, Africa, North America, and internationally.
Undervalued with moderate growth potential.
Similar Companies
Market Insights

Advertisement
Community Narratives
Groundbreaking therapies that could change the treatment landscape for PTSD, fibromyalgia, MS & Alzheimer’s
Fair Value US$6.20|86.8% undervalued
CM
Community Contributor
DigitalOcean Will Grow 14% by Embracing AI with Paperspace Acquisition
Fair Value US$50.00|43.5% undervalued
NE
Community Contributor
Viant Technology: A Rising AdTech Challenger in the AI-Powered CTV Market
Fair Value US$38.61|61.4% undervalued
BL
Community Contributor
Volvo will Accelerate Forward into Electric and Autonomous Leadership in Five Years
Fair Value SEK 438.80|40.8% undervalued
UN
Community Contributor