
Advertisement
David Iben put it well when he said, 'Volatility is not a risk we care about. What we care about is avoiding the permanent loss of capital.' It's only natural to consider a company's balance sheet when you examine how risky it is, since debt is often involved when a business collapses. We note that TrueBlue, Inc. (NYSE:TBI) does have debt on its balance sheet. But the more important question is: how much risk is that debt creating?
Why Does Debt Bring Risk?
Debt and other liabilities become risky for a business when it cannot easily fulfill those obligations, either with free cash flow or by raising capital at an attractive price. In the worst case scenario, a company can go bankrupt if it cannot pay its creditors. However, a more frequent (but still costly) occurrence is where a company must issue shares at bargain-basement prices, permanently diluting shareholders, just to shore up its balance sheet. By replacing dilution, though, debt can be an extremely good tool for businesses that need capital to invest in growth at high rates of return. When we examine debt levels, we first consider both cash and debt levels, together.
Check out our latest analysis for TrueBlue
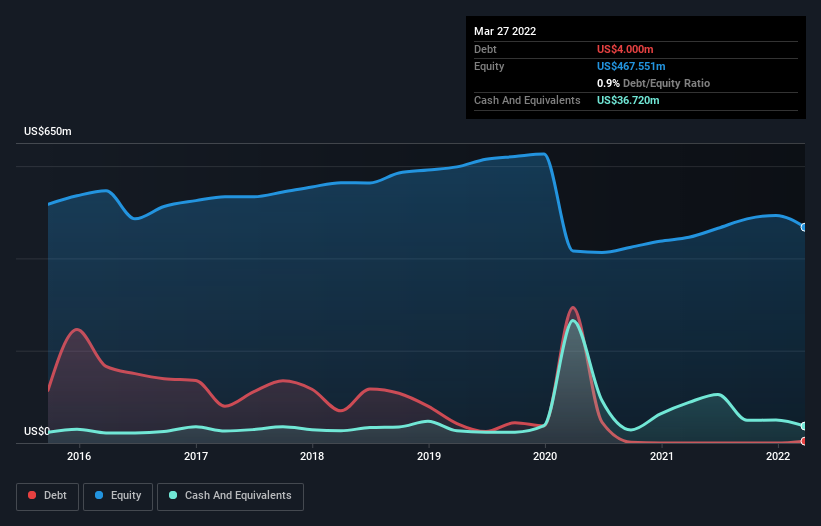
What Is TrueBlue's Net Debt?
As you can see below, at the end of March 2022, TrueBlue had US$4.00m of debt, up from none a year ago. Click the image for more detail. But it also has US$36.7m in cash to offset that, meaning it has US$32.7m net cash.
How Strong Is TrueBlue's Balance Sheet?
Zooming in on the latest balance sheet data, we can see that TrueBlue had liabilities of US$225.9m due within 12 months and liabilities of US$287.5m due beyond that. Offsetting these obligations, it had cash of US$36.7m as well as receivables valued at US$336.0m due within 12 months. So its liabilities total US$140.7m more than the combination of its cash and short-term receivables.
TrueBlue has a market capitalization of US$646.0m, so it could very likely raise cash to ameliorate its balance sheet, if the need arose. But we definitely want to keep our eyes open to indications that its debt is bringing too much risk. Despite its noteworthy liabilities, TrueBlue boasts net cash, so it's fair to say it does not have a heavy debt load!
Even more impressive was the fact that TrueBlue grew its EBIT by 998% over twelve months. If maintained that growth will make the debt even more manageable in the years ahead. When analysing debt levels, the balance sheet is the obvious place to start. But it is future earnings, more than anything, that will determine TrueBlue's ability to maintain a healthy balance sheet going forward. So if you want to see what the professionals think, you might find this free report on analyst profit forecasts to be interesting.
Finally, while the tax-man may adore accounting profits, lenders only accept cold hard cash. While TrueBlue has net cash on its balance sheet, it's still worth taking a look at its ability to convert earnings before interest and tax (EBIT) to free cash flow, to help us understand how quickly it is building (or eroding) that cash balance. Over the last three years, TrueBlue actually produced more free cash flow than EBIT. That sort of strong cash generation warms our hearts like a puppy in a bumblebee suit.
Summing Up
Although TrueBlue's balance sheet isn't particularly strong, due to the total liabilities, it is clearly positive to see that it has net cash of US$32.7m. The cherry on top was that in converted 127% of that EBIT to free cash flow, bringing in -US$12m. So we don't think TrueBlue's use of debt is risky. Another factor that would give us confidence in TrueBlue would be if insiders have been buying shares: if you're conscious of that signal too, you can find out instantly by clicking this link.
At the end of the day, it's often better to focus on companies that are free from net debt. You can access our special list of such companies (all with a track record of profit growth). It's free.
Valuation is complex, but we're here to simplify it.
Discover if TrueBlue might be undervalued or overvalued with our detailed analysis, featuring fair value estimates, potential risks, dividends, insider trades, and its financial condition.
Access Free AnalysisHave feedback on this article? Concerned about the content? Get in touch with us directly. Alternatively, email editorial-team (at) simplywallst.com.
This article by Simply Wall St is general in nature. We provide commentary based on historical data and analyst forecasts only using an unbiased methodology and our articles are not intended to be financial advice. It does not constitute a recommendation to buy or sell any stock, and does not take account of your objectives, or your financial situation. We aim to bring you long-term focused analysis driven by fundamental data. Note that our analysis may not factor in the latest price-sensitive company announcements or qualitative material. Simply Wall St has no position in any stocks mentioned.
About NYSE:TBI
TrueBlue
Provides specialized workforce solutions in the United States, Canada, the United Kingdom, Australia, and Puerto Rico.
Undervalued with mediocre balance sheet.
Similar Companies
Market Insights


Advertisement
Community Narratives
The Next Phase of Defense AI: A Robotic Response to America’s Security Gaps
Fair Value US$12.00|51.2% undervalued
MA
Community Contributor
Figma (FIG): The S&P 500’s Design Standard Turning Into an All-in-One Platform
Fair Value US$65.70|6.7% overvalued
TI
Community Contributor
Sleep Cycle's Revenue Set to Rise 10% with Strong Revenue Model
Fair Value SEK 38.04|19.4% undervalued
MA
Community Contributor
Has JB Hi-Fi Lost Its Point of Difference?
Fair Value AU$76.00|53.6% overvalued
RO
Community Contributor