
The external fund manager backed by Berkshire Hathaway's Charlie Munger, Li Lu, makes no bones about it when he says 'The biggest investment risk is not the volatility of prices, but whether you will suffer a permanent loss of capital.' So it seems the smart money knows that debt - which is usually involved in bankruptcies - is a very important factor, when you assess how risky a company is. As with many other companies Quad/Graphics, Inc. (NYSE:QUAD) makes use of debt. But the real question is whether this debt is making the company risky.
When Is Debt Dangerous?
Debt assists a business until the business has trouble paying it off, either with new capital or with free cash flow. In the worst case scenario, a company can go bankrupt if it cannot pay its creditors. However, a more frequent (but still costly) occurrence is where a company must issue shares at bargain-basement prices, permanently diluting shareholders, just to shore up its balance sheet. Of course, debt can be an important tool in businesses, particularly capital heavy businesses. When we examine debt levels, we first consider both cash and debt levels, together.
See our latest analysis for Quad/Graphics
How Much Debt Does Quad/Graphics Carry?
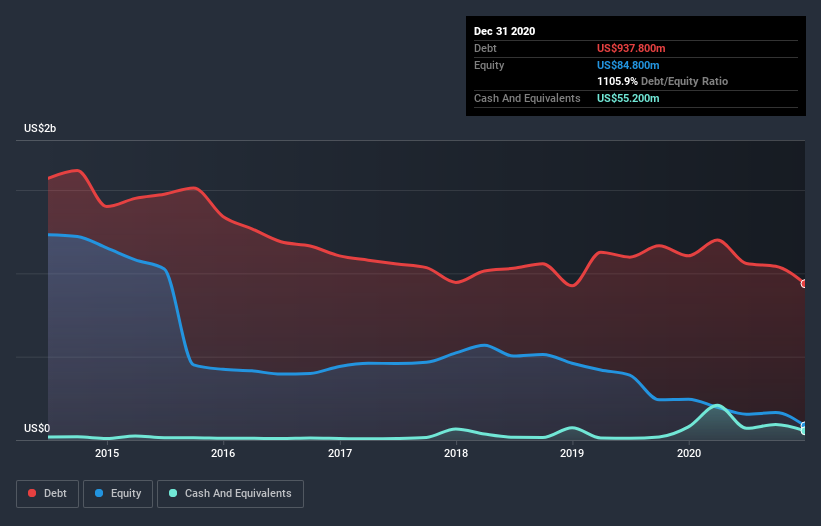
The image below, which you can click on for greater detail, shows that Quad/Graphics had debt of US$937.8m at the end of December 2020, a reduction from US$1.10b over a year. On the flip side, it has US$55.2m in cash leading to net debt of about US$882.6m.
How Strong Is Quad/Graphics' Balance Sheet?
We can see from the most recent balance sheet that Quad/Graphics had liabilities of US$682.7m falling due within a year, and liabilities of US$1.16b due beyond that. Offsetting these obligations, it had cash of US$55.2m as well as receivables valued at US$399.1m due within 12 months. So its liabilities outweigh the sum of its cash and (near-term) receivables by US$1.39b.
This deficit casts a shadow over the US$205.2m company, like a colossus towering over mere mortals. So we definitely think shareholders need to watch this one closely. At the end of the day, Quad/Graphics would probably need a major re-capitalization if its creditors were to demand repayment.
We use two main ratios to inform us about debt levels relative to earnings. The first is net debt divided by earnings before interest, tax, depreciation, and amortization (EBITDA), while the second is how many times its earnings before interest and tax (EBIT) covers its interest expense (or its interest cover, for short). The advantage of this approach is that we take into account both the absolute quantum of debt (with net debt to EBITDA) and the actual interest expenses associated with that debt (with its interest cover ratio).
While Quad/Graphics's debt to EBITDA ratio (3.3) suggests that it uses some debt, its interest cover is very weak, at 1.2, suggesting high leverage. In large part that's due to the company's significant depreciation and amortisation charges, which arguably mean its EBITDA is a very generous measure of earnings, and its debt may be more of a burden than it first appears. So shareholders should probably be aware that interest expenses appear to have really impacted the business lately. Even worse, Quad/Graphics saw its EBIT tank 37% over the last 12 months. If earnings keep going like that over the long term, it has a snowball's chance in hell of paying off that debt. When analysing debt levels, the balance sheet is the obvious place to start. But it is Quad/Graphics's earnings that will influence how the balance sheet holds up in the future. So when considering debt, it's definitely worth looking at the earnings trend. Click here for an interactive snapshot.
But our final consideration is also important, because a company cannot pay debt with paper profits; it needs cold hard cash. So the logical step is to look at the proportion of that EBIT that is matched by actual free cash flow. Over the most recent three years, Quad/Graphics recorded free cash flow worth 80% of its EBIT, which is around normal, given free cash flow excludes interest and tax. This free cash flow puts the company in a good position to pay down debt, when appropriate.
Our View
On the face of it, Quad/Graphics's EBIT growth rate left us tentative about the stock, and its level of total liabilities was no more enticing than the one empty restaurant on the busiest night of the year. But at least it's pretty decent at converting EBIT to free cash flow; that's encouraging. Overall, it seems to us that Quad/Graphics's balance sheet is really quite a risk to the business. For this reason we're pretty cautious about the stock, and we think shareholders should keep a close eye on its liquidity. There's no doubt that we learn most about debt from the balance sheet. However, not all investment risk resides within the balance sheet - far from it. Case in point: We've spotted 1 warning sign for Quad/Graphics you should be aware of.
When all is said and done, sometimes its easier to focus on companies that don't even need debt. Readers can access a list of growth stocks with zero net debt 100% free, right now.
If you decide to trade Quad/Graphics, use the lowest-cost* platform that is rated #1 Overall by Barron’s, Interactive Brokers. Trade stocks, options, futures, forex, bonds and funds on 135 markets, all from a single integrated account. Promoted
If you're looking to trade Quad/Graphics, open an account with the lowest-cost platform trusted by professionals, Interactive Brokers.
With clients in over 200 countries and territories, and access to 160 markets, IBKR lets you trade stocks, options, futures, forex, bonds and funds from a single integrated account.
Enjoy no hidden fees, no account minimums, and FX conversion rates as low as 0.03%, far better than what most brokers offer.
Sponsored ContentValuation is complex, but we're here to simplify it.
Discover if Quad/Graphics might be undervalued or overvalued with our detailed analysis, featuring fair value estimates, potential risks, dividends, insider trades, and its financial condition.
Access Free AnalysisThis article by Simply Wall St is general in nature. It does not constitute a recommendation to buy or sell any stock, and does not take account of your objectives, or your financial situation. We aim to bring you long-term focused analysis driven by fundamental data. Note that our analysis may not factor in the latest price-sensitive company announcements or qualitative material. Simply Wall St has no position in any stocks mentioned.
*Interactive Brokers Rated Lowest Cost Broker by StockBrokers.com Annual Online Review 2020
Have feedback on this article? Concerned about the content? Get in touch with us directly. Alternatively, email editorial-team (at) simplywallst.com.
About NYSE:QUAD
Quad/Graphics
Provides marketing solutions in North America, Mexico, Central America, the Caribbean, Europe, the Middle East, Africa, South America, and Asia.
Undervalued with moderate growth potential.
Similar Companies
Market Insights

Community Narratives

