
Advertisement
- United States
- /
- Commercial Services
- /
- NYSE:NL
NL Industries (NYSE:NL) Is Looking To Continue Growing Its Returns On Capital

Finding a business that has the potential to grow substantially is not easy, but it is possible if we look at a few key financial metrics. In a perfect world, we'd like to see a company investing more capital into its business and ideally the returns earned from that capital are also increasing. This shows us that it's a compounding machine, able to continually reinvest its earnings back into the business and generate higher returns. So when we looked at NL Industries (NYSE:NL) and its trend of ROCE, we really liked what we saw.
Understanding Return On Capital Employed (ROCE)
For those that aren't sure what ROCE is, it measures the amount of pre-tax profits a company can generate from the capital employed in its business. Analysts use this formula to calculate it for NL Industries:
Return on Capital Employed = Earnings Before Interest and Tax (EBIT) ÷ (Total Assets - Current Liabilities)
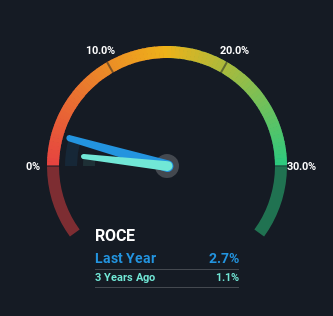
0.027 = US$15m ÷ (US$586m - US$29m) (Based on the trailing twelve months to June 2023).
Thus, NL Industries has an ROCE of 2.7%. In absolute terms, that's a low return and it also under-performs the Commercial Services industry average of 8.5%.
Check out our latest analysis for NL Industries
While the past is not representative of the future, it can be helpful to know how a company has performed historically, which is why we have this chart above. If you want to delve into the historical earnings, revenue and cash flow of NL Industries, check out these free graphs here.
What Does the ROCE Trend For NL Industries Tell Us?
While the ROCE isn't as high as some other companies out there, it's great to see it's on the up. More specifically, while the company has kept capital employed relatively flat over the last five years, the ROCE has climbed 209% in that same time. So our take on this is that the business has increased efficiencies to generate these higher returns, all the while not needing to make any additional investments. On that front, things are looking good so it's worth exploring what management has said about growth plans going forward.
In another part of our analysis, we noticed that the company's ratio of current liabilities to total assets decreased to 5.0%, which broadly means the business is relying less on its suppliers or short-term creditors to fund its operations. So this improvement in ROCE has come from the business' underlying economics, which is great to see.
The Bottom Line
As discussed above, NL Industries appears to be getting more proficient at generating returns since capital employed has remained flat but earnings (before interest and tax) are up. Astute investors may have an opportunity here because the stock has declined 18% in the last five years. With that in mind, we believe the promising trends warrant this stock for further investigation.
One more thing, we've spotted 1 warning sign facing NL Industries that you might find interesting.
For those who like to invest in solid companies, check out this free list of companies with solid balance sheets and high returns on equity.
Valuation is complex, but we're here to simplify it.
Discover if NL Industries might be undervalued or overvalued with our detailed analysis, featuring fair value estimates, potential risks, dividends, insider trades, and its financial condition.
Access Free AnalysisHave feedback on this article? Concerned about the content? Get in touch with us directly. Alternatively, email editorial-team (at) simplywallst.com.
This article by Simply Wall St is general in nature. We provide commentary based on historical data and analyst forecasts only using an unbiased methodology and our articles are not intended to be financial advice. It does not constitute a recommendation to buy or sell any stock, and does not take account of your objectives, or your financial situation. We aim to bring you long-term focused analysis driven by fundamental data. Note that our analysis may not factor in the latest price-sensitive company announcements or qualitative material. Simply Wall St has no position in any stocks mentioned.
About NYSE:NL
NL Industries
Through its subsidiaries, operates in the component products industry in Europe, North America, the Asia Pacific, and internationally.
Flawless balance sheet and good value.
Market Insights

Advertisement
Community Narratives
Nike's Direct-to-Consumer Focus Will Drive Future Growth
Fair Value US$87.90|17.0% undervalued
UN
Community Contributor
Novo Nordisk will dominate GLP-1 market with Ozempic and Wegovy growth
Fair Value US$89.59|11.8% undervalued
BE
Community Contributor
Rheinmetall could get 20-25% of EU-NATO 3%-GDP defence spending
Fair Value €7.57k|82.4% undervalued
NO
Community Contributor