
Advertisement
- United States
- /
- Professional Services
- /
- NYSE:MMS
Maximus, Inc.'s (NYSE:MMS) Fundamentals Look Pretty Strong: Could The Market Be Wrong About The Stock?
It is hard to get excited after looking at Maximus' (NYSE:MMS) recent performance, when its stock has declined 8.0% over the past month. But if you pay close attention, you might find that its key financial indicators look quite decent, which could mean that the stock could potentially rise in the long-term given how markets usually reward more resilient long-term fundamentals. In this article, we decided to focus on Maximus' ROE.
Return on equity or ROE is a key measure used to assess how efficiently a company's management is utilizing the company's capital. Put another way, it reveals the company's success at turning shareholder investments into profits.
How To Calculate Return On Equity?
Return on equity can be calculated by using the formula:
Return on Equity = Net Profit (from continuing operations) ÷ Shareholders' Equity
So, based on the above formula, the ROE for Maximus is:
18% = US$300m ÷ US$1.7b (Based on the trailing twelve months to March 2025).
The 'return' is the amount earned after tax over the last twelve months. So, this means that for every $1 of its shareholder's investments, the company generates a profit of $0.18.
View our latest analysis for Maximus
What Has ROE Got To Do With Earnings Growth?
So far, we've learned that ROE is a measure of a company's profitability. We now need to evaluate how much profit the company reinvests or "retains" for future growth which then gives us an idea about the growth potential of the company. Assuming everything else remains unchanged, the higher the ROE and profit retention, the higher the growth rate of a company compared to companies that don't necessarily bear these characteristics.
A Side By Side comparison of Maximus' Earnings Growth And 18% ROE
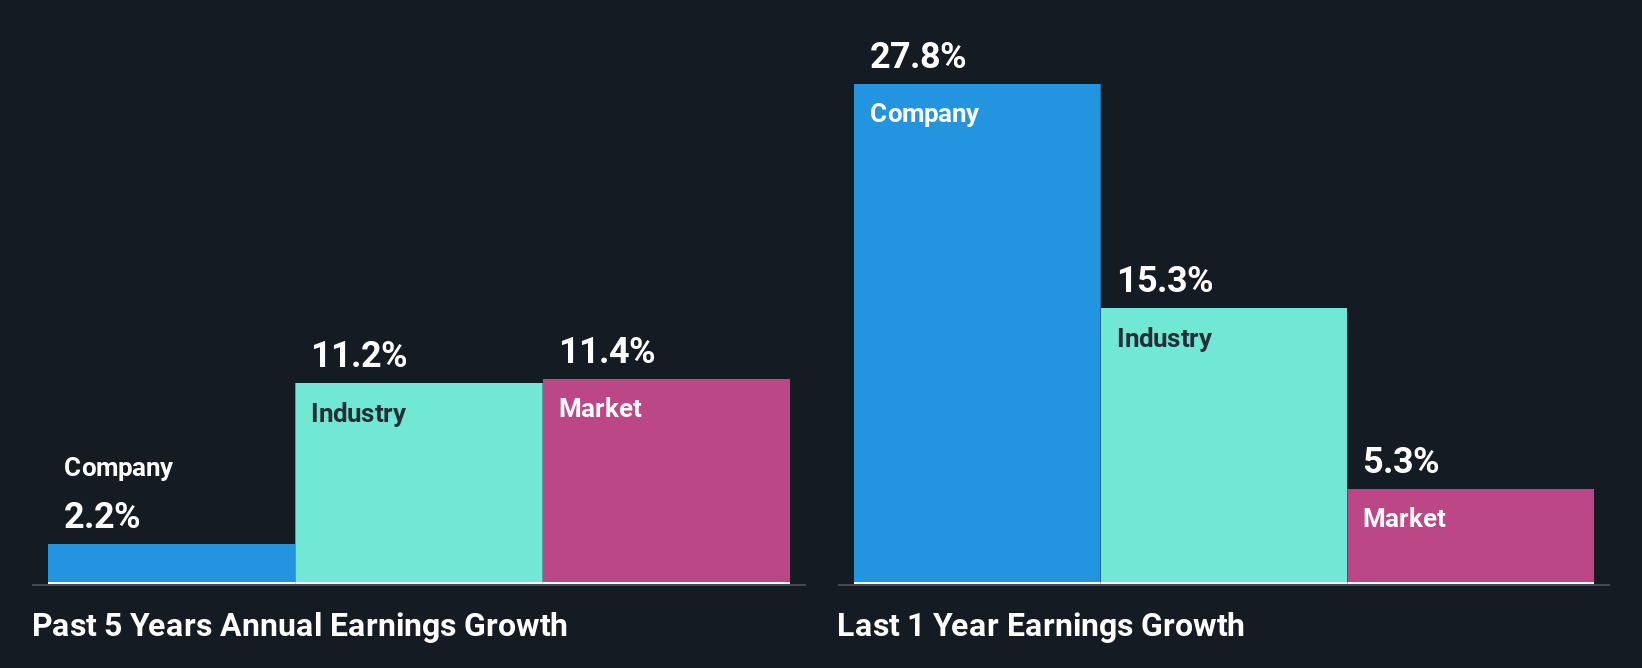
At first glance, Maximus seems to have a decent ROE. And on comparing with the industry, we found that the the average industry ROE is similar at 20%. Maximus' decent returns aren't reflected in Maximus'mediocre five year net income growth average of 2.2%. A few likely reasons that could be keeping earnings growth low are - the company has a high payout ratio or the business has allocated capital poorly, for instance.
As a next step, we compared Maximus' net income growth with the industry and were disappointed to see that the company's growth is lower than the industry average growth of 11% in the same period.
Earnings growth is an important metric to consider when valuing a stock. What investors need to determine next is if the expected earnings growth, or the lack of it, is already built into the share price. Doing so will help them establish if the stock's future looks promising or ominous. Has the market priced in the future outlook for MMS? You can find out in our latest intrinsic value infographic research report.
Is Maximus Efficiently Re-investing Its Profits?
Despite having a moderate three-year median payout ratio of 34% (implying that the company retains the remaining 66% of its income), Maximus' earnings growth was quite low. Therefore, there might be some other reasons to explain the lack in that respect. For example, the business could be in decline.
Moreover, Maximus has been paying dividends for at least ten years or more suggesting that management must have perceived that the shareholders prefer dividends over earnings growth.
Conclusion
On the whole, we do feel that Maximus has some positive attributes. Although, we are disappointed to see a lack of growth in earnings even in spite of a high ROE and and a high reinvestment rate. We believe that there might be some outside factors that could be having a negative impact on the business. With that said, the latest industry analyst forecasts reveal that the company's earnings are expected to accelerate. Are these analysts expectations based on the broad expectations for the industry, or on the company's fundamentals? Click here to be taken to our analyst's forecasts page for the company.
New: Manage All Your Stock Portfolios in One Place
We've created the ultimate portfolio companion for stock investors, and it's free.
• Connect an unlimited number of Portfolios and see your total in one currency
• Be alerted to new Warning Signs or Risks via email or mobile
• Track the Fair Value of your stocks
Have feedback on this article? Concerned about the content? Get in touch with us directly. Alternatively, email editorial-team (at) simplywallst.com.
This article by Simply Wall St is general in nature. We provide commentary based on historical data and analyst forecasts only using an unbiased methodology and our articles are not intended to be financial advice. It does not constitute a recommendation to buy or sell any stock, and does not take account of your objectives, or your financial situation. We aim to bring you long-term focused analysis driven by fundamental data. Note that our analysis may not factor in the latest price-sensitive company announcements or qualitative material. Simply Wall St has no position in any stocks mentioned.
About NYSE:MMS
Undervalued with proven track record.
Similar Companies
Market Insights

Advertisement
Community Narratives
Quality at a Premium. A time to watch, not to buy?
Fair Value US$154.56|26.1% undervalued
DA
Community Contributor
GRAB: The Super-App at the Heart of Southeast Asia’s Digital Boom
Fair Value US$8.20|21.3% undervalued
BL
Community Contributor
Verve Group to Surge with 51.61% Revenue Growth
Fair Value €6.00|61.2% undervalued
ME
Community Contributor