
Advertisement
- United States
- /
- Professional Services
- /
- NYSE:DAY
Estimating The Intrinsic Value Of Dayforce Inc. (NYSE:DAY)
Key Insights
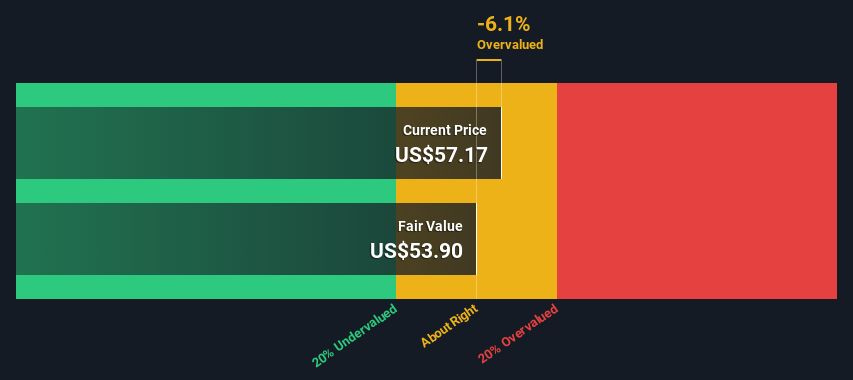
- Using the 2 Stage Free Cash Flow to Equity, Dayforce fair value estimate is US$53.90
- With US$57.17 share price, Dayforce appears to be trading close to its estimated fair value
- Analyst price target for DAY is US$69.08, which is 28% above our fair value estimate
Today we'll do a simple run through of a valuation method used to estimate the attractiveness of Dayforce Inc. (NYSE:DAY) as an investment opportunity by taking the expected future cash flows and discounting them to their present value. Our analysis will employ the Discounted Cash Flow (DCF) model. Believe it or not, it's not too difficult to follow, as you'll see from our example!
We would caution that there are many ways of valuing a company and, like the DCF, each technique has advantages and disadvantages in certain scenarios. Anyone interested in learning a bit more about intrinsic value should have a read of the Simply Wall St analysis model.
See our latest analysis for Dayforce
Crunching The Numbers
We are going to use a two-stage DCF model, which, as the name states, takes into account two stages of growth. The first stage is generally a higher growth period which levels off heading towards the terminal value, captured in the second 'steady growth' period. To begin with, we have to get estimates of the next ten years of cash flows. Where possible we use analyst estimates, but when these aren't available we extrapolate the previous free cash flow (FCF) from the last estimate or reported value. We assume companies with shrinking free cash flow will slow their rate of shrinkage, and that companies with growing free cash flow will see their growth rate slow, over this period. We do this to reflect that growth tends to slow more in the early years than it does in later years.
A DCF is all about the idea that a dollar in the future is less valuable than a dollar today, so we need to discount the sum of these future cash flows to arrive at a present value estimate:
10-year free cash flow (FCF) estimate
| 2025 | 2026 | 2027 | 2028 | 2029 | 2030 | 2031 | 2032 | 2033 | 2034 | |
| Levered FCF ($, Millions) | US$244.2m | US$280.4m | US$307.3m | US$330.3m | US$350.1m | US$367.4m | US$382.9m | US$397.1m | US$410.3m | US$423.0m |
| Growth Rate Estimate Source | Analyst x4 | Analyst x2 | Est @ 9.62% | Est @ 7.49% | Est @ 5.99% | Est @ 4.94% | Est @ 4.21% | Est @ 3.70% | Est @ 3.34% | Est @ 3.09% |
| Present Value ($, Millions) Discounted @ 6.4% | US$230 | US$248 | US$255 | US$258 | US$257 | US$254 | US$249 | US$242 | US$236 | US$228 |
("Est" = FCF growth rate estimated by Simply Wall St)
Present Value of 10-year Cash Flow (PVCF) = US$2.5b
After calculating the present value of future cash flows in the initial 10-year period, we need to calculate the Terminal Value, which accounts for all future cash flows beyond the first stage. For a number of reasons a very conservative growth rate is used that cannot exceed that of a country's GDP growth. In this case we have used the 5-year average of the 10-year government bond yield (2.5%) to estimate future growth. In the same way as with the 10-year 'growth' period, we discount future cash flows to today's value, using a cost of equity of 6.4%.
Terminal Value (TV)= FCF2034 × (1 + g) ÷ (r – g) = US$423m× (1 + 2.5%) ÷ (6.4%– 2.5%) = US$11b
Present Value of Terminal Value (PVTV)= TV / (1 + r)10= US$11b÷ ( 1 + 6.4%)10= US$6.1b
The total value, or equity value, is then the sum of the present value of the future cash flows, which in this case is US$8.5b. The last step is to then divide the equity value by the number of shares outstanding. Relative to the current share price of US$57.2, the company appears around fair value at the time of writing. The assumptions in any calculation have a big impact on the valuation, so it is better to view this as a rough estimate, not precise down to the last cent.
Important Assumptions
The calculation above is very dependent on two assumptions. The first is the discount rate and the other is the cash flows. You don't have to agree with these inputs, I recommend redoing the calculations yourself and playing with them. The DCF also does not consider the possible cyclicality of an industry, or a company's future capital requirements, so it does not give a full picture of a company's potential performance. Given that we are looking at Dayforce as potential shareholders, the cost of equity is used as the discount rate, rather than the cost of capital (or weighted average cost of capital, WACC) which accounts for debt. In this calculation we've used 6.4%, which is based on a levered beta of 0.937. Beta is a measure of a stock's volatility, compared to the market as a whole. We get our beta from the industry average beta of globally comparable companies, with an imposed limit between 0.8 and 2.0, which is a reasonable range for a stable business.
SWOT Analysis for Dayforce
Strength
- Net debt to equity ratio below 40%.
Weakness
- Interest payments on debt are not well covered.
- Expensive based on P/S ratio and estimated fair value.
- Shareholders have been diluted in the past year.
Opportunity
- Annual earnings are forecast to grow faster than the American market.
Threat
- Debt is not well covered by operating cash flow.
- Revenue is forecast to grow slower than 20% per year.
Next Steps:
Although the valuation of a company is important, it is only one of many factors that you need to assess for a company. DCF models are not the be-all and end-all of investment valuation. Rather it should be seen as a guide to "what assumptions need to be true for this stock to be under/overvalued?" For instance, if the terminal value growth rate is adjusted slightly, it can dramatically alter the overall result. For Dayforce, there are three pertinent items you should look at:
- Risks: As an example, we've found 1 warning sign for Dayforce that you need to consider before investing here.
- Future Earnings: How does DAY's growth rate compare to its peers and the wider market? Dig deeper into the analyst consensus number for the upcoming years by interacting with our free analyst growth expectation chart.
- Other Solid Businesses: Low debt, high returns on equity and good past performance are fundamental to a strong business. Why not explore our interactive list of stocks with solid business fundamentals to see if there are other companies you may not have considered!
PS. Simply Wall St updates its DCF calculation for every American stock every day, so if you want to find the intrinsic value of any other stock just search here.
New: Manage All Your Stock Portfolios in One Place
We've created the ultimate portfolio companion for stock investors, and it's free.
• Connect an unlimited number of Portfolios and see your total in one currency
• Be alerted to new Warning Signs or Risks via email or mobile
• Track the Fair Value of your stocks
Have feedback on this article? Concerned about the content? Get in touch with us directly. Alternatively, email editorial-team (at) simplywallst.com.
This article by Simply Wall St is general in nature. We provide commentary based on historical data and analyst forecasts only using an unbiased methodology and our articles are not intended to be financial advice. It does not constitute a recommendation to buy or sell any stock, and does not take account of your objectives, or your financial situation. We aim to bring you long-term focused analysis driven by fundamental data. Note that our analysis may not factor in the latest price-sensitive company announcements or qualitative material. Simply Wall St has no position in any stocks mentioned.
About NYSE:DAY
Dayforce
Operates as a human capital management (HCM) software company in the United States, Canada, Australia, and internationally.
Flawless balance sheet with moderate growth potential.
Similar Companies
Market Insights

Advertisement
Weekly Picks
RO


RockeTeller on Santacruz Silver Mining ·
Crazy Undervalued 42 Baggers Silver Play (Active & Running Mine)
Fair Value:CA$8696.7% undervalued
59 followersusers have followed this narrative
7 commentsusers have commented on this narrative
17 likesusers have liked this narrative
RO


Robbo on Fiducian Group ·
Fiducian: Compliance Clouds or Value Opportunity?
Fair Value:AU$122.0% undervalued
9 followersusers have followed this narrative
0 commentsusers have commented on this narrative
0 likesusers have liked this narrative
WO

woodworthfund on Willamette Valley Vineyards ·
Willamette Valley Vineyards (WVVI): Not-So-Great Value
Fair Value:US$242.5% overvalued
10 followersusers have followed this narrative
0 commentsusers have commented on this narrative
1 likeusers have liked this narrative
Recently Updated Narratives
WO

woodworthfund on MGP Ingredients ·
THE KINGDOM OF BROWN GOODS: WHY MGPI IS BEING CRUSHED BY INVENTORY & PRIMED FOR RESURRECTION
Fair Value:US$4035.8% undervalued
3 followersusers have followed this narrative
0 commentsusers have commented on this narrative
0 likesusers have liked this narrative
DA


davidlsander on Beam Therapeutics ·
The "Molecular Pencil": Why Beam's Technology is Built to Win
Fair Value:US$15081.9% undervalued
50 followersusers have followed this narrative
3 commentsusers have commented on this narrative
1 likeusers have liked this narrative
MO


mo7md on ADNOC Gas ·
ADNOC Gas future shines with a 21.4% revenue surge
Fair Value:د.إ3.728.9% undervalued
3 followersusers have followed this narrative
0 commentsusers have commented on this narrative
0 likesusers have liked this narrative
Popular Narratives
TH


TheWallstreetKing on MicroVision ·
MicroVision will explode future revenue by 380.37% with a vision towards success
Fair Value:US$6098.5% undervalued
117 followersusers have followed this narrative
11 commentsusers have commented on this narrative
22 likesusers have liked this narrative
AN


AnalystConsensusTarget on NVIDIA ·
NVDA: Expanding AI Demand Will Drive Major Data Center Investments Through 2026
Fair Value:US$250.3927.2% undervalued
959 followersusers have followed this narrative
6 commentsusers have commented on this narrative
25 likesusers have liked this narrative
RO
RockeTeller on Santacruz Silver Mining ·
Crazy Undervalued 42 Baggers Silver Play (Active & Running Mine)
Fair Value:CA$8696.7% undervalued
59 followersusers have followed this narrative
7 commentsusers have commented on this narrative
17 likesusers have liked this narrative
