Advertisement
- United States
- /
- Commercial Services
- /
- NYSE:BCO
Does Brink's Recent 24.5% Rally Still Offer Upside in 2025?

Simply Wall St
Reviewed by Bailey Pemberton
If you are asking yourself whether it's the right time to stick with Brink's, take some profits, or finally jump in, you're in good company. Brink's has been anything but sleepy lately. Over the last five years, the stock is up a whopping 147.4%, and in just the last three years, it's climbed 109.6%. Even with a quieter past month, flat at just 0.2%, and a slight dip of -1.0% over the last week, Brink's is still sitting on a solid 24.5% gain year-to-date. Clearly, long-term momentum has been on its side, though the pace has cooled a bit in the shorter term. For a stock tied to the often-overlooked business of secure logistics, that is no small feat.
Some of this performance can be traced to changing views about the value and stability of cash logistics, especially as markets reassess risk and security post-pandemic. While flashy tech names steal headlines, investors have started seeing Brink’s as a potential anchor in portfolios, steady and undervalued compared to its rapid growth. In fact, when we look at how the company's stock stacks up on different valuation checks, Brink's earns a value score of 3 out of 6. That suggests it is undervalued by some methods but not across the board.
Now, let’s dive into those valuation approaches, what passes the tests, and where the stock might be a bit rich. Then we can explore an even smarter way to think about what Brink’s is really worth, beyond just the numbers.
Approach 1: Brink's Discounted Cash Flow (DCF) Analysis
The Discounted Cash Flow (DCF) model estimates what a company is truly worth by projecting its future cash flows and then discounting those amounts back to today’s dollars. This approach helps investors judge whether the current share price reflects the company’s real earning potential, regardless of market noise.
For Brink’s, the latest twelve months’ free cash flow stands at $353.9 million. Over the next decade, analysts expect free cash flow to trend slightly lower before resuming gentle growth, with projections such as $340.1 million in 2026 and reaching about $383.1 million by 2035. Estimates through 2030 are based on analyst forecasts, while years beyond that are extrapolated to provide a longer-term perspective.
Based on these projections, the DCF model values Brink’s intrinsic value at $130.38 per share. This is 11.8% higher than the current price, which suggests that the stock may be undervalued at today’s levels.
Result: UNDERVALUED
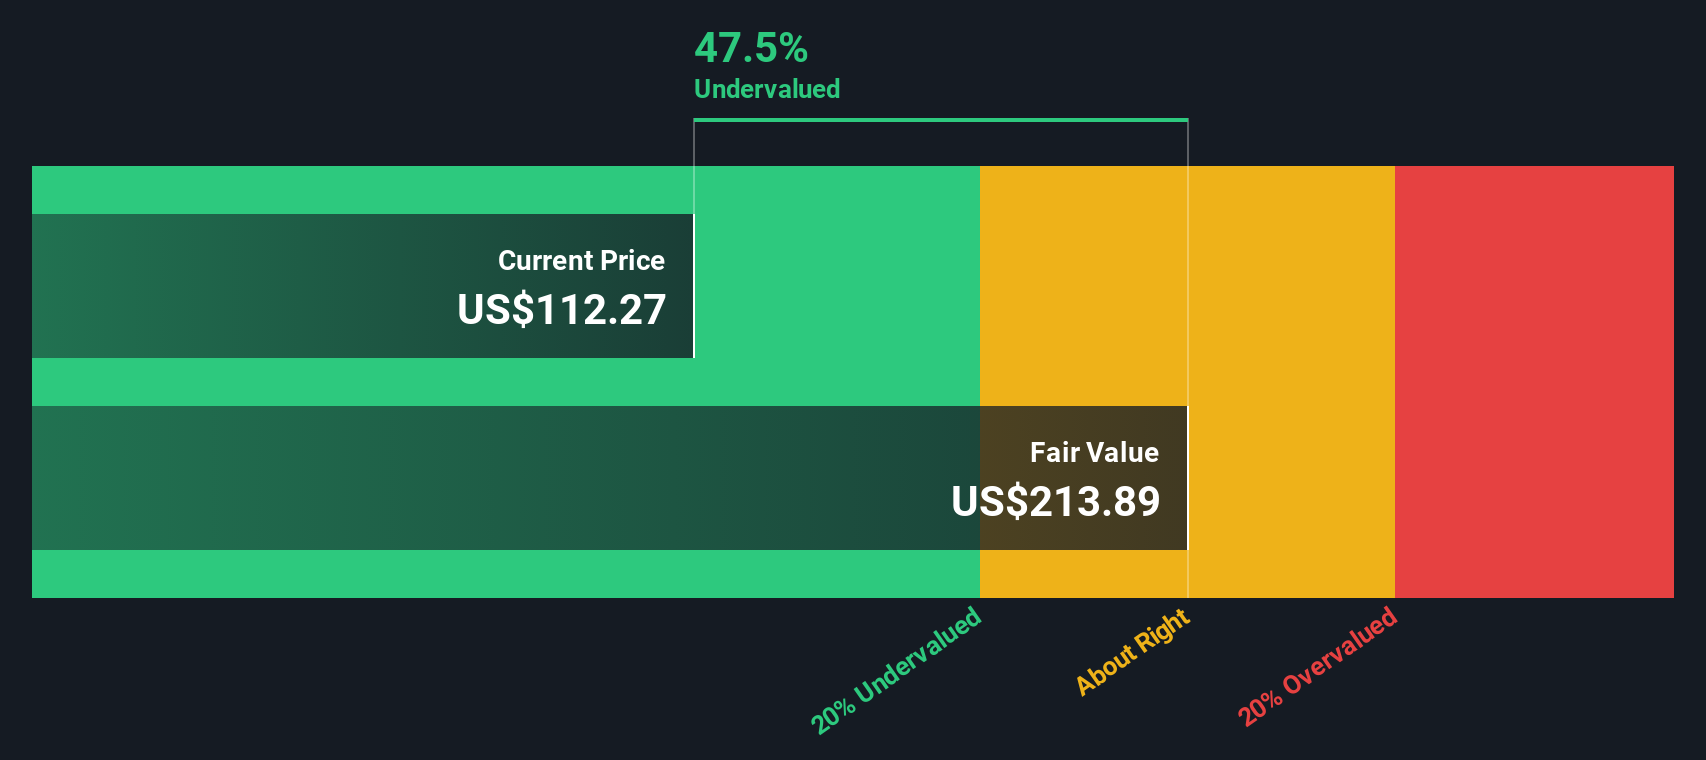
Our Discounted Cash Flow (DCF) analysis suggests Brink's is undervalued by 11.8%. Track this in your watchlist or portfolio, or discover more undervalued stocks.
Approach 2: Brink's Price vs Earnings
For profitable companies like Brink’s, the price-to-earnings (PE) ratio is a widely accepted way to gauge valuation because it directly relates the market price to earnings power. It quickly tells investors how much they are paying for each dollar of earnings. Growth expectations and risk influence what counts as a “normal” or “fair” PE ratio. Faster-growing, less risky companies usually attract a higher PE, while slower-growing or riskier names trade at lower multiples.
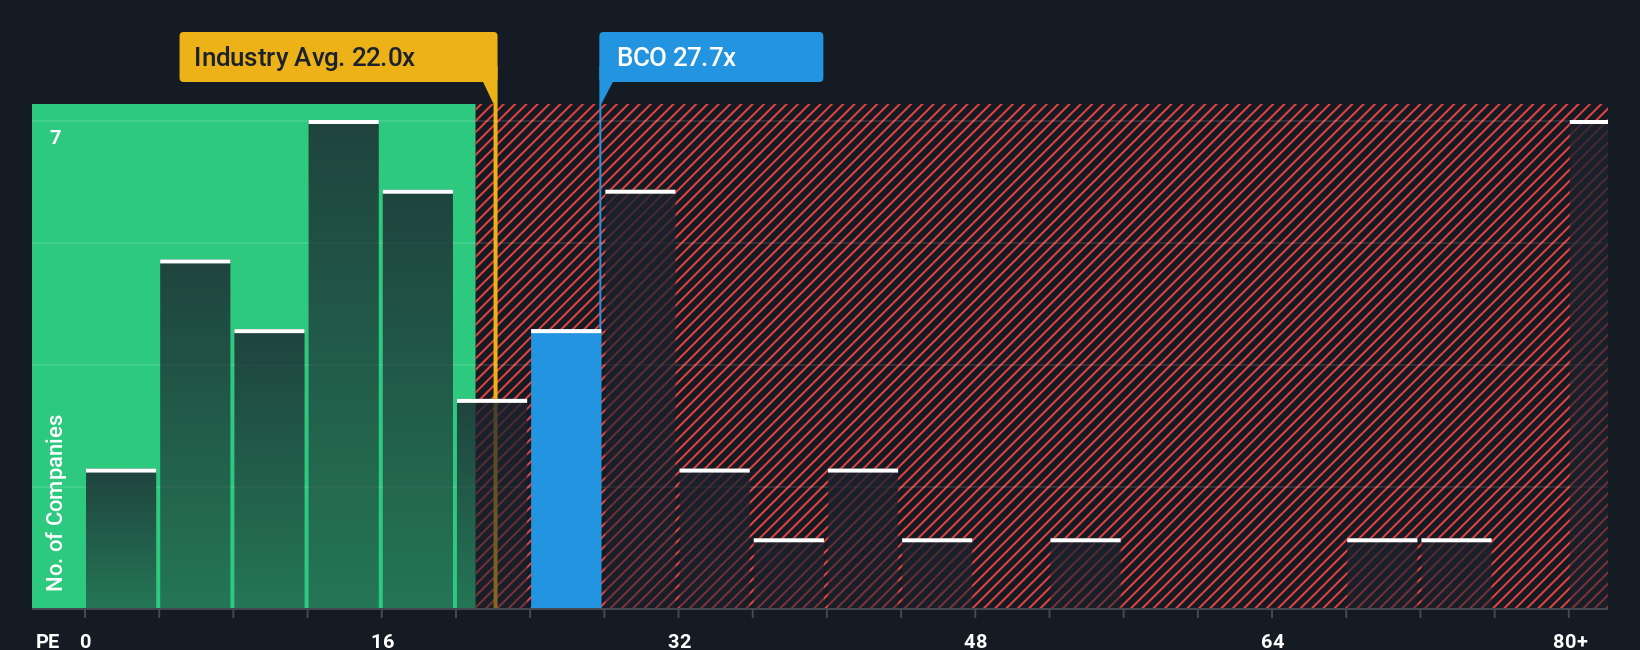
Right now, Brink’s trades at a PE ratio of 29.6x. That’s higher than both the Commercial Services industry average of 28.0x and the average PE of its peer group, which stands at 23.5x. On the surface, this might make Brink’s look a bit expensive compared to its competition.
This is where the Simply Wall St Fair Ratio comes in. Unlike crude industry comparisons, this metric customizes the “normal” PE by factoring in Brink’s growth prospects, risk profile, profit margin, market cap, and the overall industry environment. For Brink’s, the Fair Ratio works out to 45.1x. This suggests that, when you weigh all those company-specific factors, a higher multiple is actually justified for the stock.
Comparing this Fair Ratio of 45.1x to Brink's actual PE of 29.6x, the stock screens as undervalued on a relative basis, especially when you adjust for its full financial and strategic context.
Result: UNDERVALUED
PE ratios tell one story, but what if the real opportunity lies elsewhere? Discover companies where insiders are betting big on explosive growth.
Upgrade Your Decision Making: Choose your Brink's Narrative
Earlier we mentioned that there’s an even better way to understand valuation, so let’s introduce you to Narratives, a smarter, more dynamic approach available on Simply Wall St’s Community page.
A Narrative is simply your perspective, the story you tell about Brink’s, grounded in your own assumptions about its future growth, earnings, and fair value, not just the headline numbers. Instead of relying solely on ratios or price targets, Narratives connect what’s happening in Brink’s business to a financial forecast and a calculated fair value, so you can see how the story unfolds in real numbers.
Narratives make investing accessible because anyone can use them. They are visually intuitive, easy to build or modify in seconds, and are already used by millions of investors alongside analyst consensus on Simply Wall St. They help you decide whether to buy, hold, or sell by directly comparing your own Fair Value to the current Price, and they update automatically as soon as new news or earnings are released.
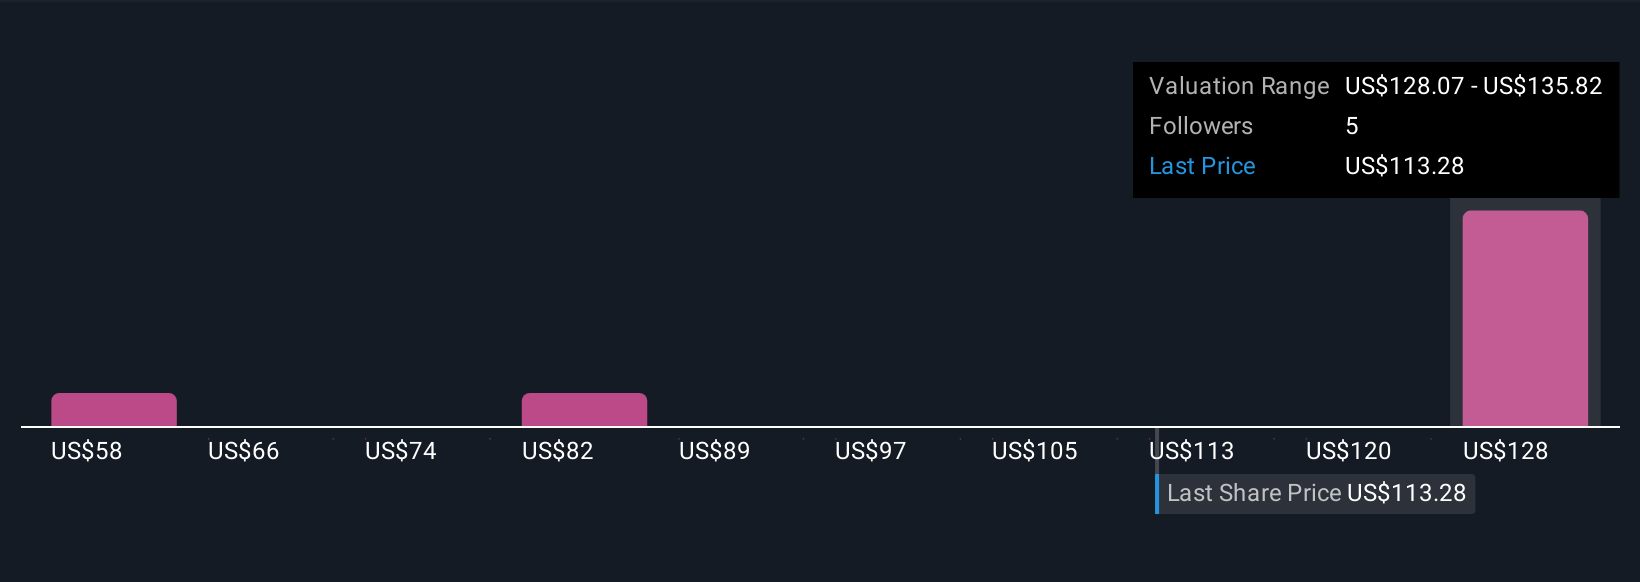
For Brink’s, one investor’s Narrative might forecast high-margin digital solutions and global expansion leading to a $128.50 fair value, while another sees digital disruption capping upside below $110. Narratives put you in control by linking your view of Brink’s story to actionable investment decisions.
Do you think there's more to the story for Brink's? Create your own Narrative to let the Community know!
This article by Simply Wall St is general in nature. We provide commentary based on historical data and analyst forecasts only using an unbiased methodology and our articles are not intended to be financial advice. It does not constitute a recommendation to buy or sell any stock, and does not take account of your objectives, or your financial situation. We aim to bring you long-term focused analysis driven by fundamental data. Note that our analysis may not factor in the latest price-sensitive company announcements or qualitative material. Simply Wall St has no position in any stocks mentioned.
Valuation is complex, but we're here to simplify it.
Discover if Brink's might be undervalued or overvalued with our detailed analysis, featuring fair value estimates, potential risks, dividends, insider trades, and its financial condition.
Access Free AnalysisHave feedback on this article? Concerned about the content? Get in touch with us directly. Alternatively, email editorial-team@simplywallst.com
About NYSE:BCO
Brink's
Provides cash and valuables management, digital retail solutions, and automated teller machines (ATM) managed services in North America, Latin America, Europe, and internationally.
Proven track record average dividend payer.
Similar Companies
Market Insights

Advertisement
Community Narratives
The Next Phase of Energy Storage: How NeoVolta Is Tackling America’s Power Crunch
Fair Value US$7.50|30.4% undervalued
MA
Community Contributor
A formidable player in AI and enterprise computing.
Fair Value US$210.00|3.0% undervalued
CO
Community Contributor
IREN's Bold Moves in Sustainable Bitcoin Mining & AI Data Centers
Fair Value US$72.52|20.4% undervalued
BL
Community Contributor
Cooling the Champions: The Aussie Tech Behind F1's Victories
Fair Value AU$12.40|38.1% undervalued
TR
Community Contributor